Granular Emission Analysis
Trusted By 500+ businesses around the world








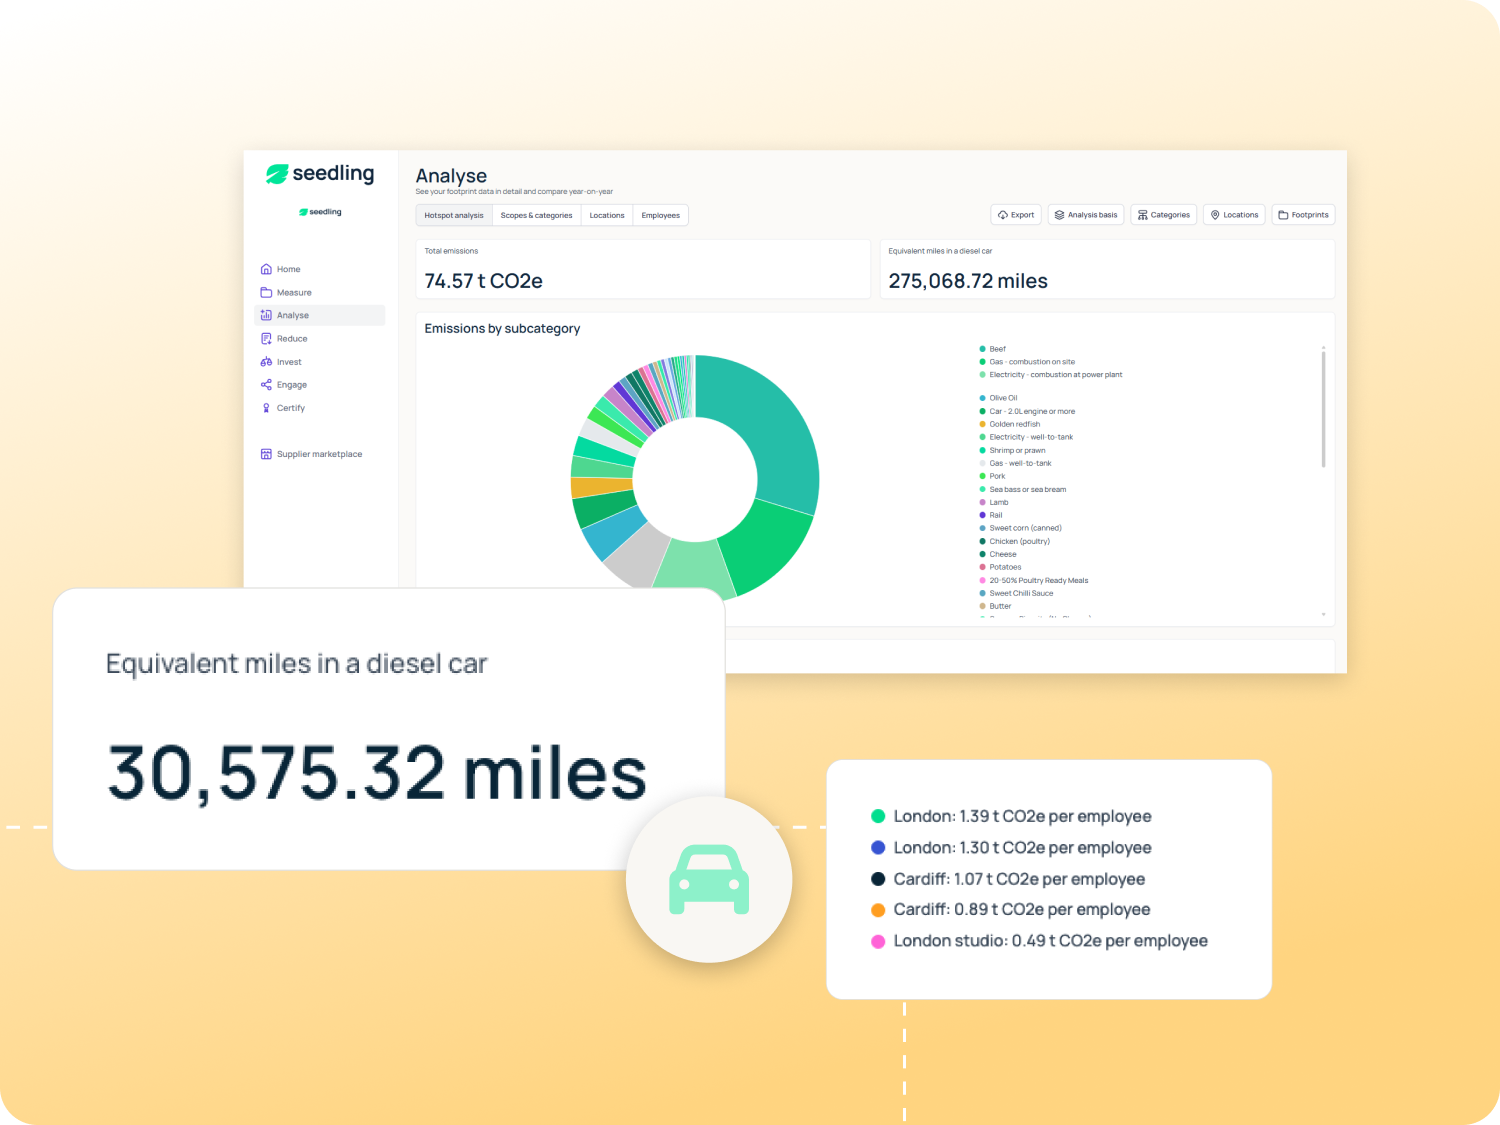
Deep-dive on your key emission sources
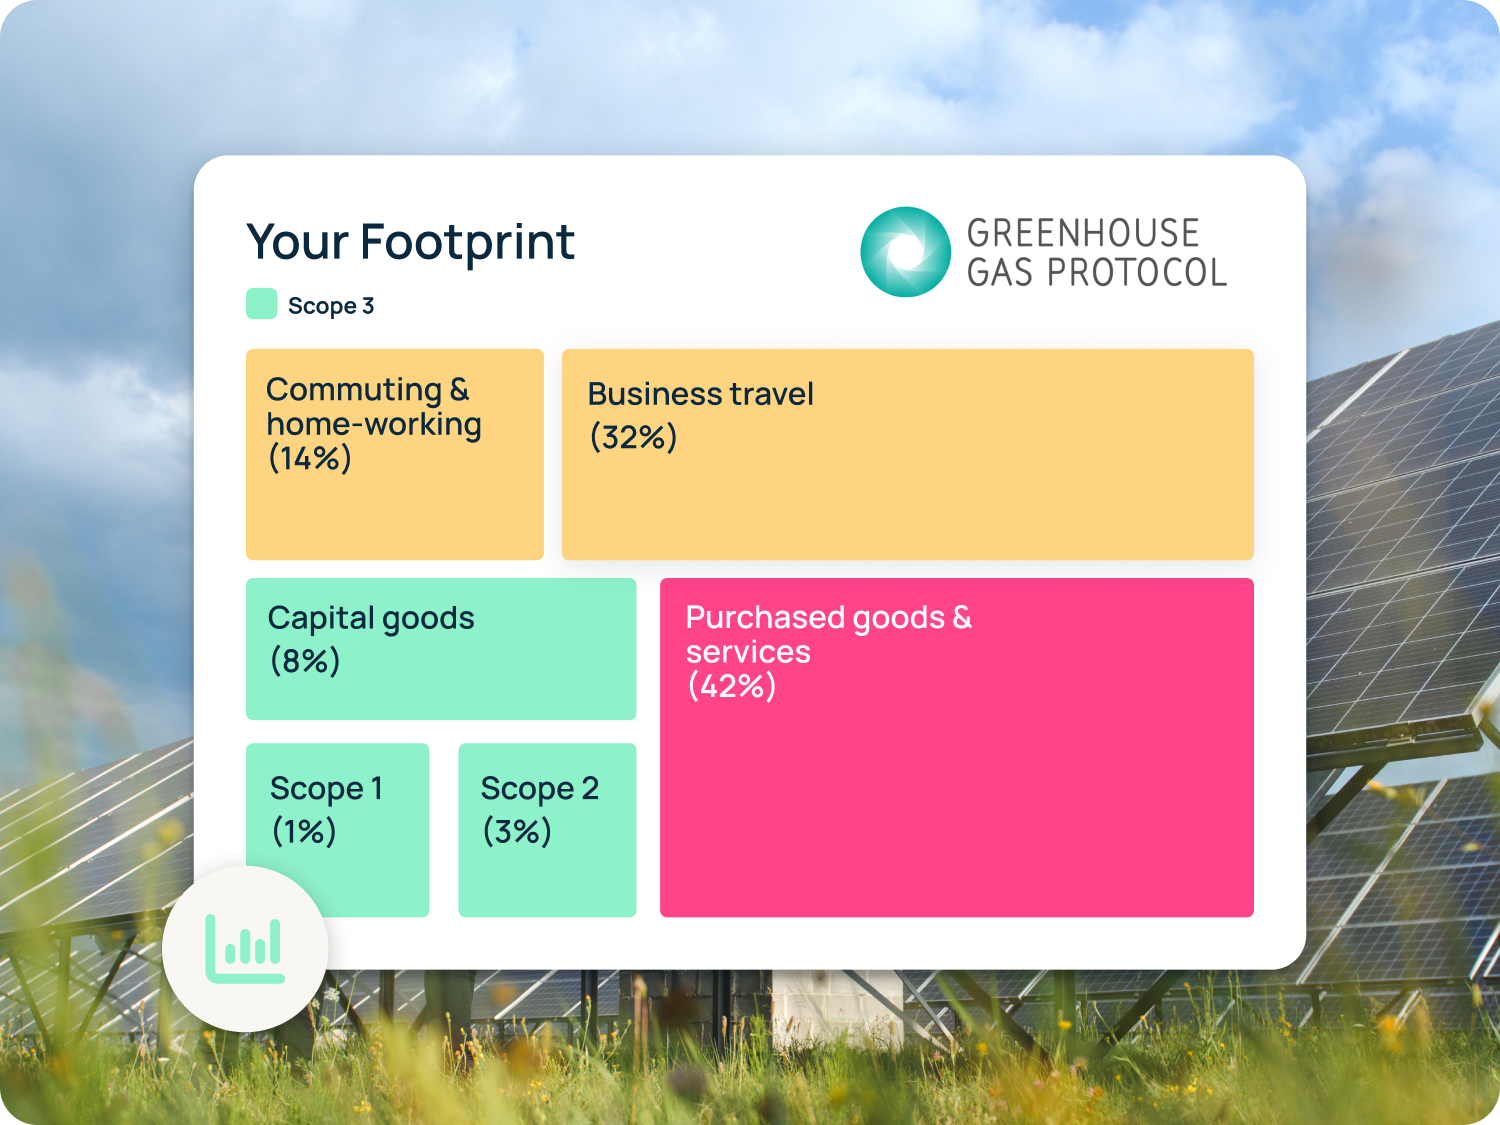
Your dashboard opens with a clear overview of your emissions by scope, then lets you go deeper. At every level you can see emissions split across Scope 1, 2 and 3 and GHG Protocol categories, as well as deep-dive breakdowns covering 1000s of granular emission sources.
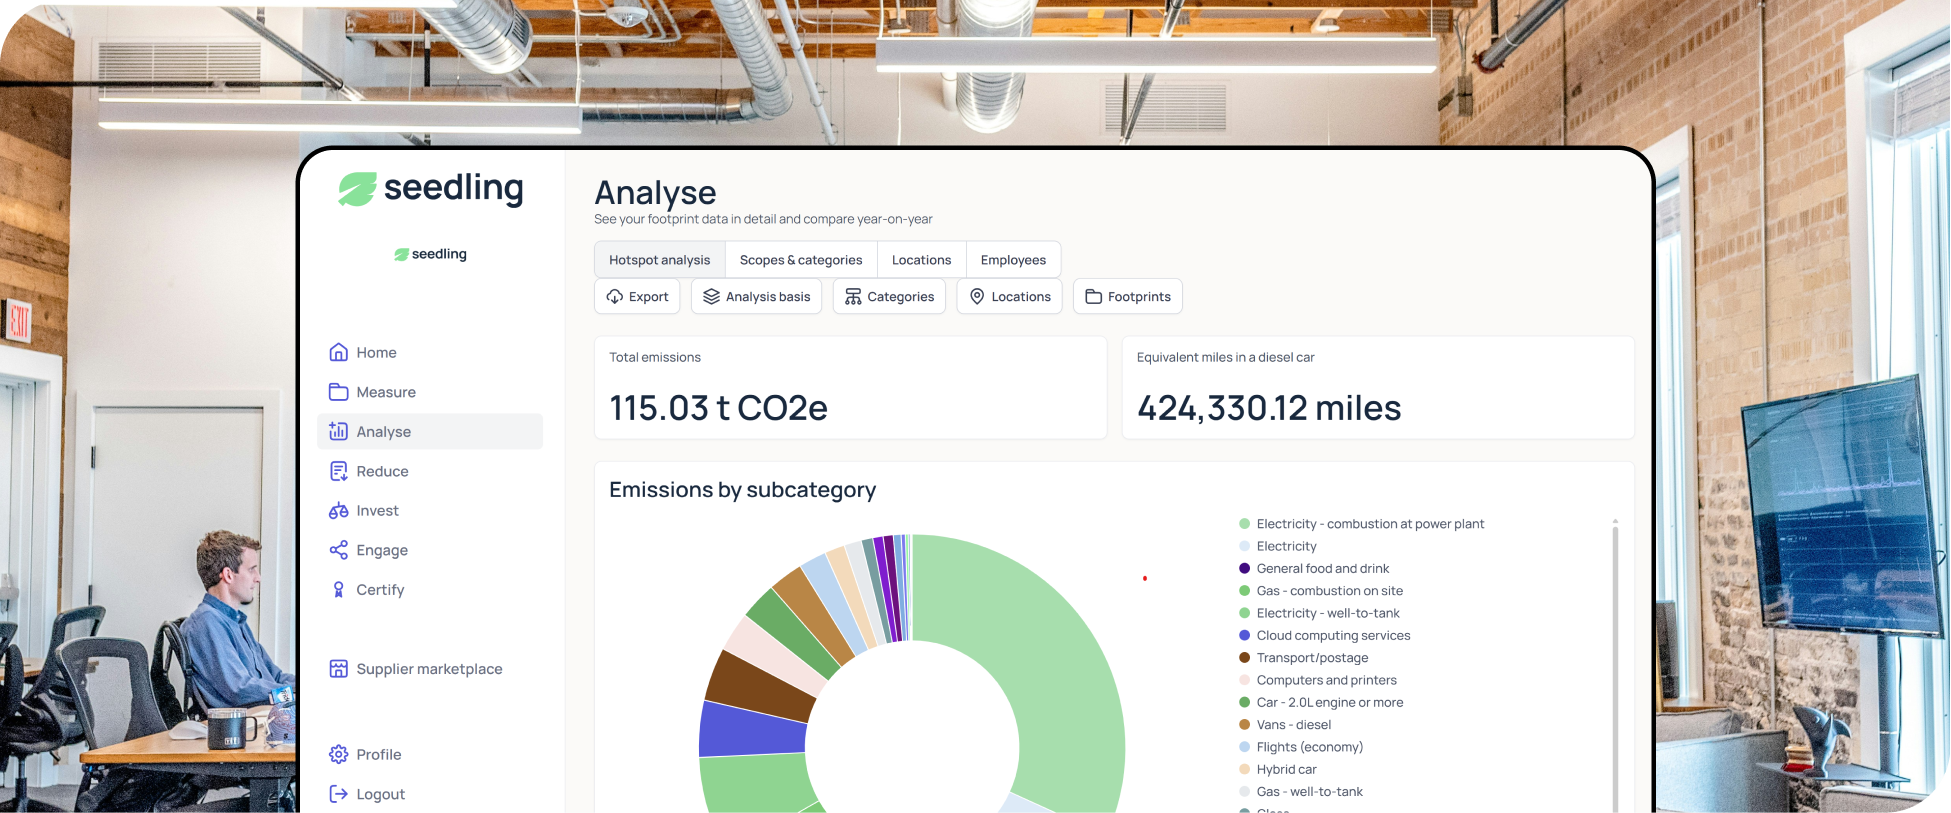
Hotspot analysis to focus your reduction efforts
Knowing your total footprint is one thing. Knowing which categories are driving it is what makes reduction planning effective. The dashboard surfaces your emissions hotspots automatically, so you can see:
- Which categories account for the largest share of your footprint across each scope
- Where emissions are growing fastest, flagging areas that need attention before they become harder to address
- How individual hotspots compare to sector benchmarks, giving context to your numbers
- Which areas offer the greatest reduction opportunity relative to cost and effort
This cuts through the noise. Rather than treating every emission source equally, your team can direct time, budget and supplier engagement towards the areas that will move the needle most.

Intensity-based analysis to track emissions as your business grows
Absolute emissions tell one part of the story. Intensity metrics tell you how efficiently your business is operating relative to its size. The dashboard lets you analyse emissions against:
- Revenue, tracking tCO2e per £/$1m turnover to monitor carbon efficiency as you scale
- Headcount, useful for service businesses where people are the primary driver of activity
- Other business metrics relevant to your sector or reporting framework
- Year-on-year intensity trends, so growth and emissions reduction can be tracked together
This is particularly valuable for businesses with stakeholders who want to see emissions performance in the context of business growth.
Book Your Free Discovery Call


More Within Reduce
Other features to help you make progress on the path to Net Zero.
What our clients say
Don't just take our word for it...
.png)





.png)



Ready to get started?

Book a demo with one of our experts today, or get started right away for free.
FAQs
Your questions answered
What is a carbon emissions dashboard and what should it show?
A carbon emissions dashboard is a centralised view of a business's greenhouse gas data, typically covering Scope 1, 2 and 3 emissions broken down by category, source and time period. A useful dashboard goes beyond totals, showing where emissions are concentrated, how they are changing over time and how they compare across sites or business units. Ours updates automatically as new data is added, so the view is always current.
What is the difference between Scope 1, 2 and 3 emissions?
Scope 1 covers direct emissions from sources your business owns or controls, such as company vehicles and on-site combustion. Scope 2 covers indirect emissions from purchased electricity, heat or steam. Scope 3 covers all other indirect emissions across your value chain, including business travel, supply chain, waste and product use. For most businesses, Scope 3 represents the largest share of their footprint and the most complex to measure and reduce.
How do carbon intensity metrics work and why do they matter?
Carbon intensity metrics express emissions relative to a measure of business output, such as revenue or headcount, rather than as an absolute total. This allows businesses to track whether they are becoming more carbon efficient over time, even as they grow. Intensity metrics are also a requirement under certain SBTi methodologies and are increasingly requested by investors and ESG rating agencies assessing decarbonisation progress.
How can I identify the biggest sources of emissions in my business?
Start with a full Scope 1, 2 and 3 footprint broken down by category. In most businesses, a small number of categories, often energy, freight, business travel or purchased goods, account for the majority of emissions. Our dashboard flags these hotspots automatically, so you can focus reduction efforts where they will have the greatest impact rather than spreading attention evenly across every emission source.
Still have questions?
Book a demo or get in touch and we'll be happy to help.
.svg)