Detaillierte Emissionsanalyse
Vertraut von über 500 Unternehmen weltweit








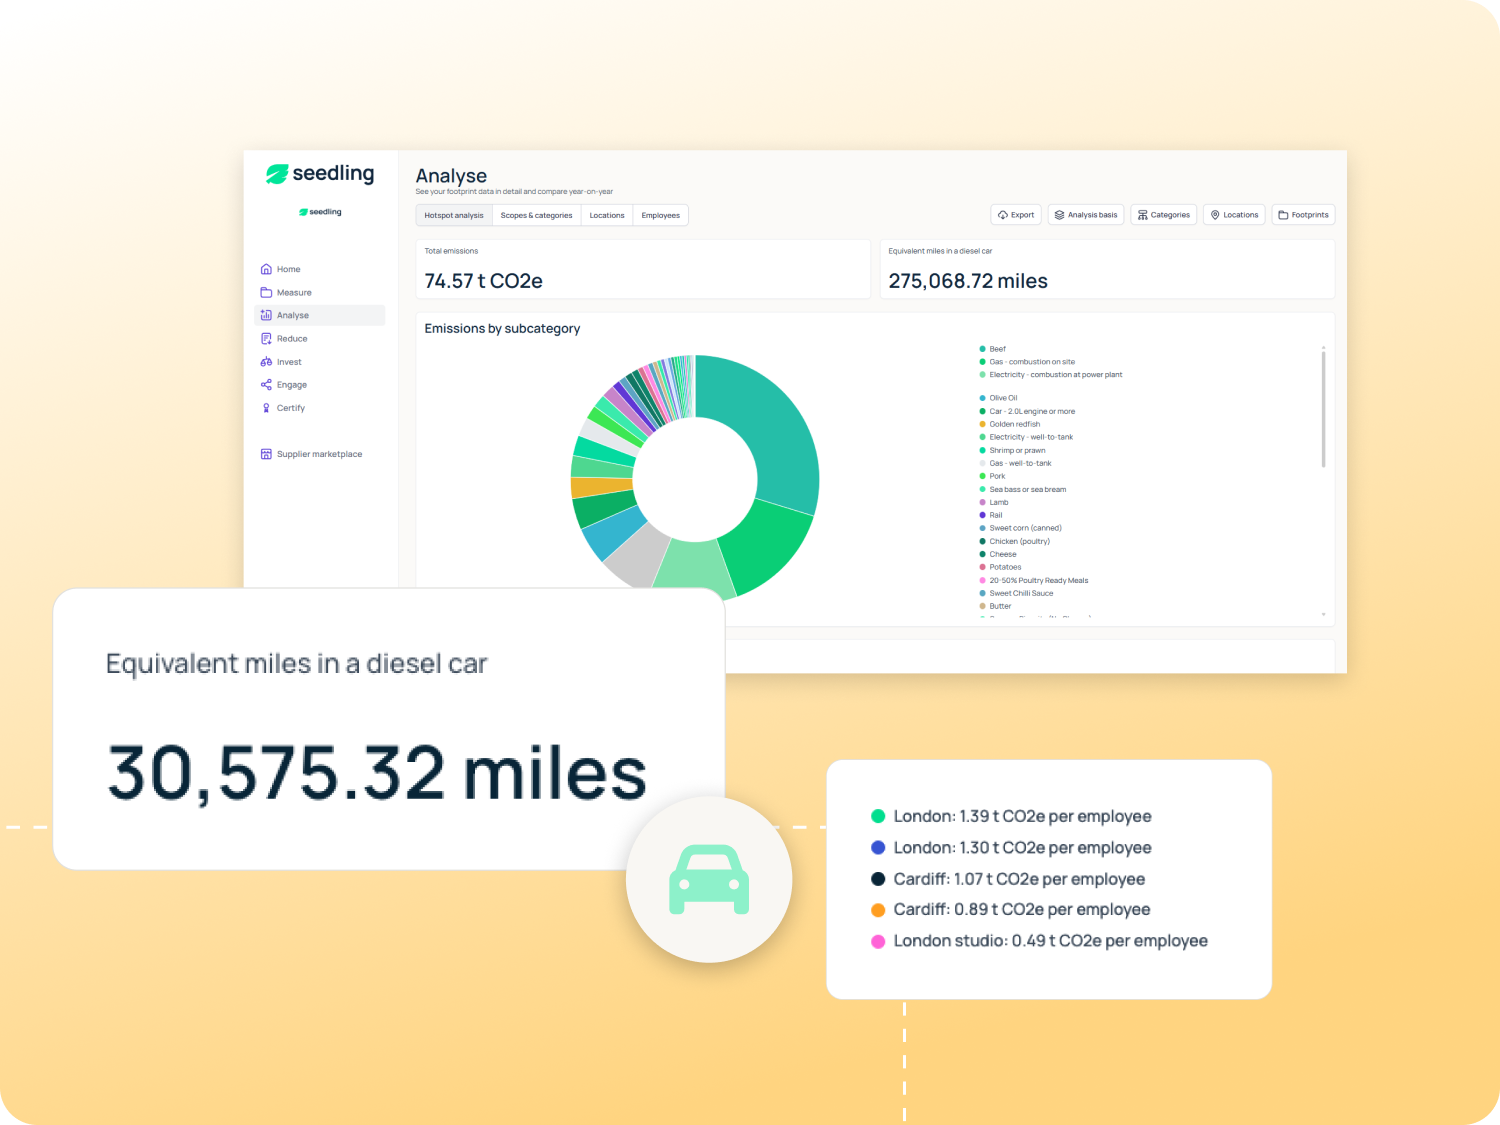
Detaillierte Analyse Ihrer wichtigsten Emissionsquellen
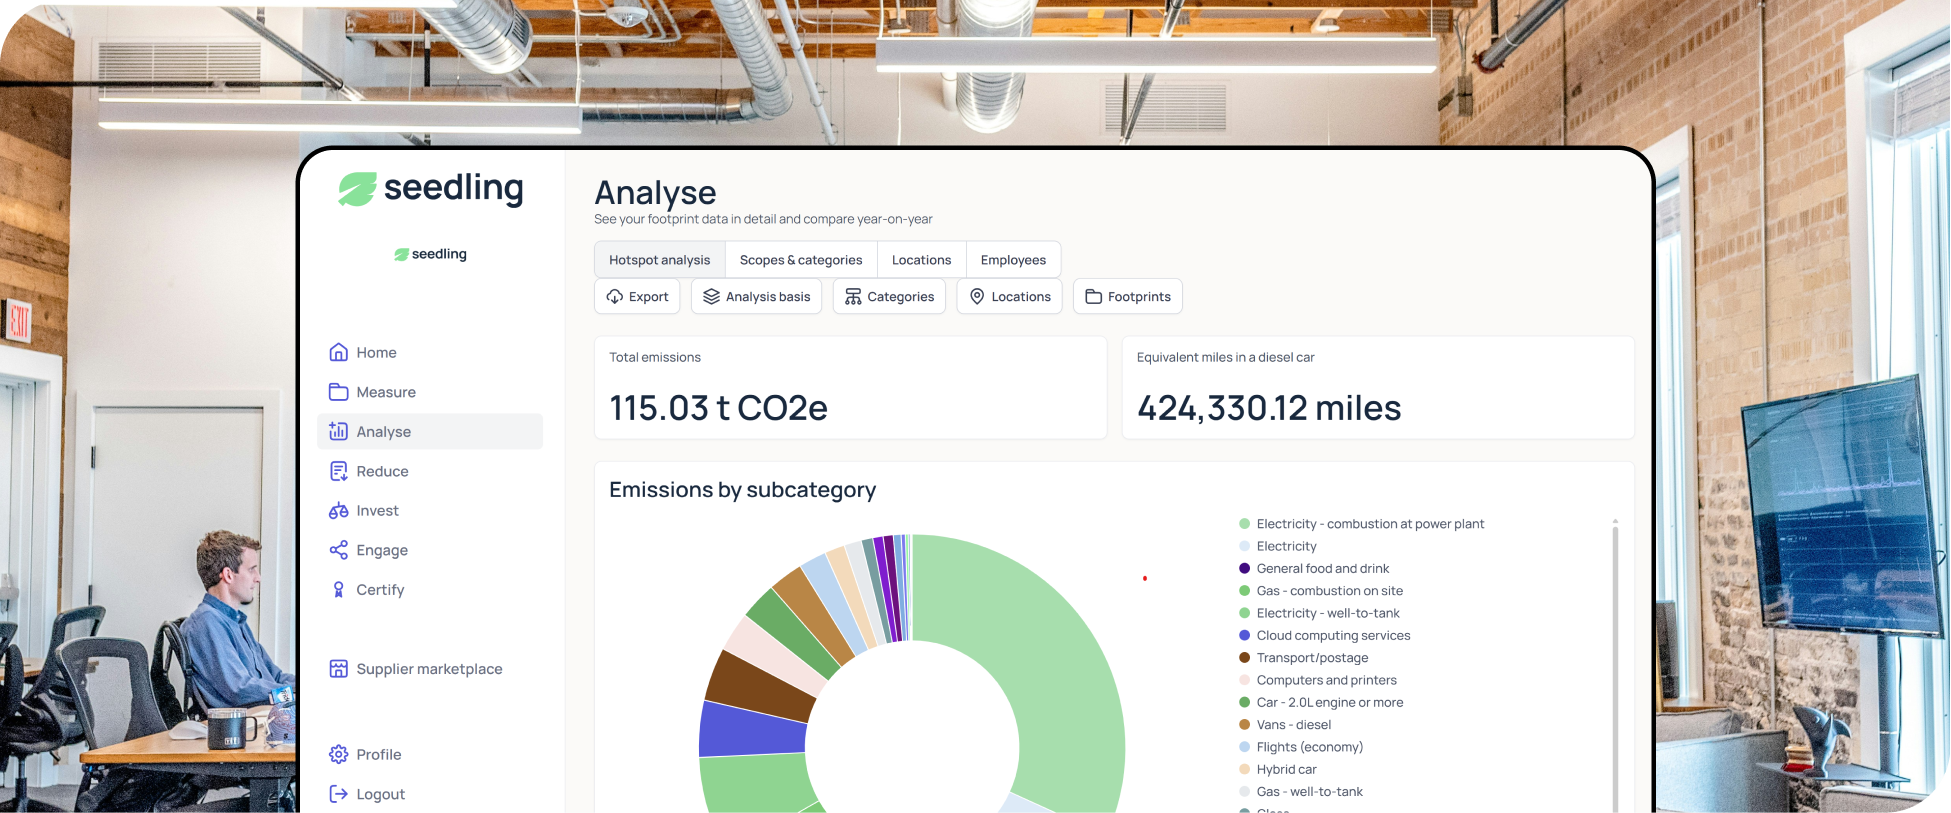
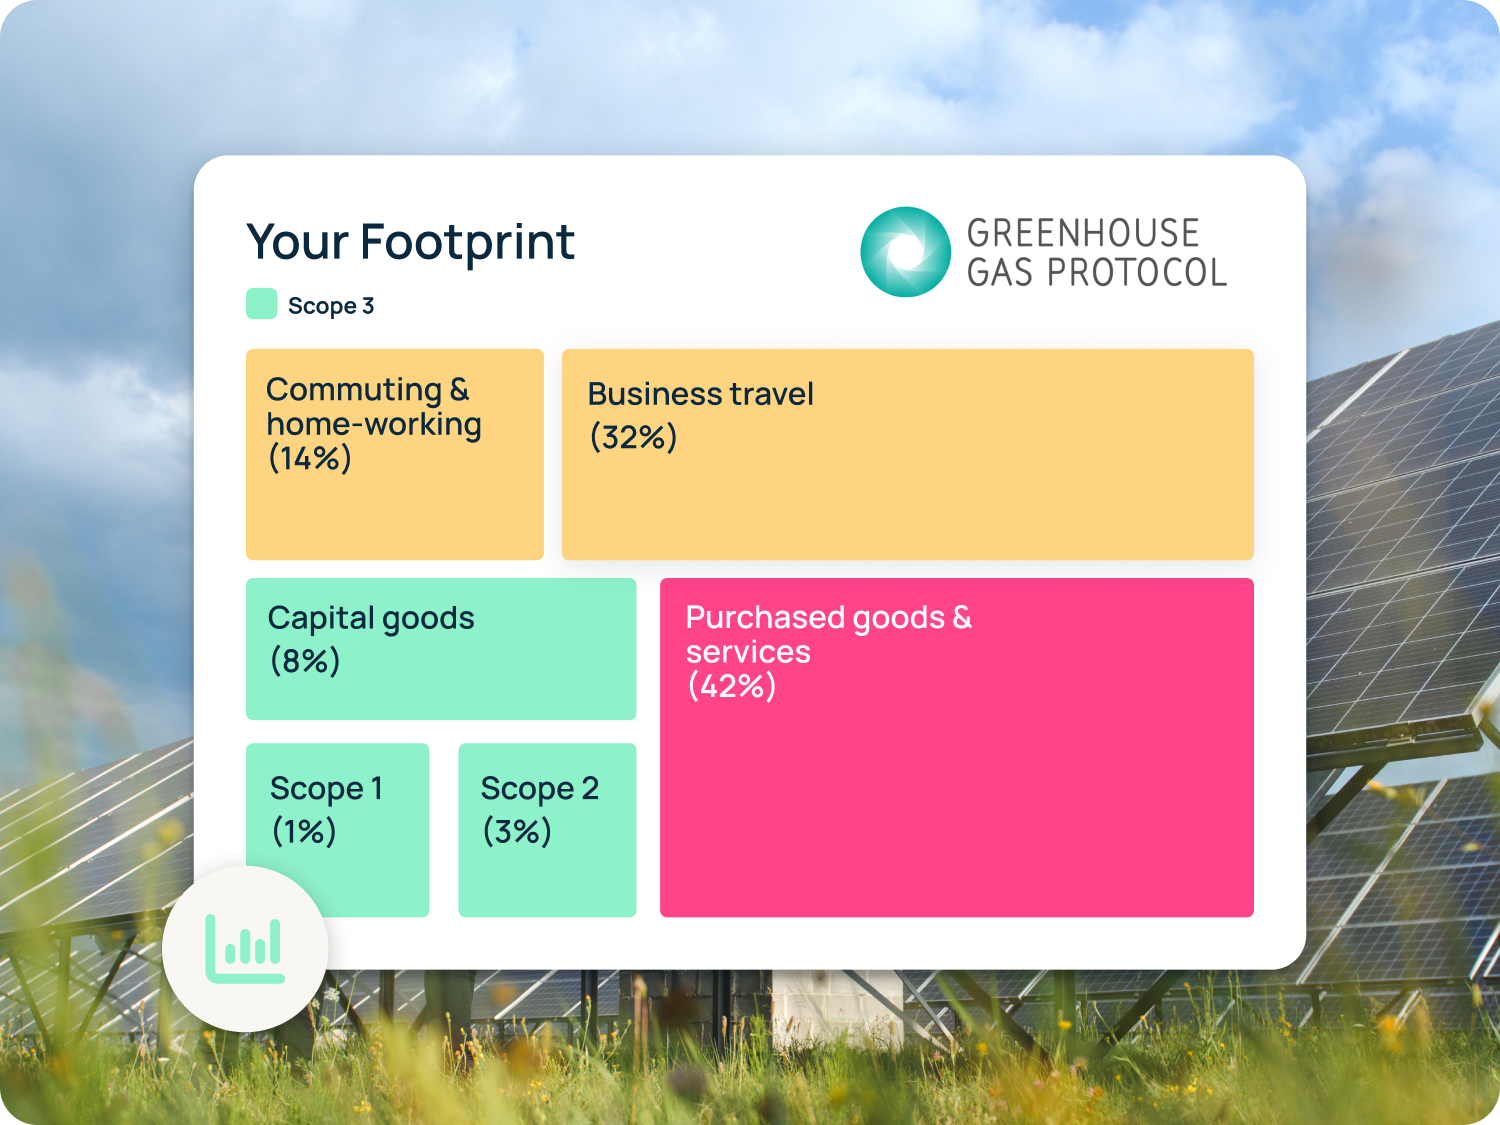
Ihr Dashboard beginnt mit einem klaren Überblick über Ihre Emissionen nach Scope und ermöglicht Ihnen anschließend tiefere Einblicke. Auf jeder Ebene können Sie die Emissionen aufgeteilt nach Scope 1, 2 und 3 sowie nach GHG-Protokoll-Kategorien einsehen und detaillierte Analysen für Tausende von spezifischen Emissionsquellen durchführen.
Hotspot-Analyse zur gezielten Steuerung Ihrer Reduzierungsmaßnahmen
Ihren gesamten Fußabdruck zu kennen, ist das eine. Zu wissen, welche Kategorien ihn maßgeblich beeinflussen, macht die Reduzierungsplanung erst effektiv. Das Dashboard identifiziert Ihre Emissions-Hotspots automatisch, sodass Sie Folgendes sehen können:
- Welche Kategorien über jeden Scope hinweg den größten Anteil an Ihrem Fußabdruck ausmachen
- Wo Emissionen am schnellsten wachsen, um Bereiche zu kennzeichnen, die Aufmerksamkeit erfordern, bevor sie schwieriger zu bewältigen sind
- Wie einzelne Hotspots im Vergleich zu Branchen-Benchmarks abschneiden, um Ihre Zahlen in einen Kontext zu setzen
- Welche Bereiche das größte Reduzierungspotenzial im Verhältnis zu Kosten und Aufwand bieten
Dies schafft Klarheit. Anstatt jede Emissionsquelle gleich zu behandeln, kann Ihr Team Zeit, Budget und Lieferantenmanagement auf die Bereiche konzentrieren, die den größten Effekt erzielen.

Intensitätsbasierte Analyse zur Verfolgung von Emissionen bei Unternehmenswachstum
Absolute Emissionswerte erzählen nur einen Teil der Geschichte. Intensitätskennzahlen zeigen Ihnen, wie effizient Ihr Unternehmen im Verhältnis zu seiner Größe arbeitet. Das Dashboard ermöglicht Ihnen die Analyse der Emissionen im Vergleich zu:
- Umsatz: Verfolgen Sie tCO2e pro 1 Mio. £/$ Umsatz, um die CO2-Effizienz während Ihrer Skalierung zu überwachen
- Mitarbeiterzahl: Nützlich für Dienstleistungsunternehmen, bei denen das Personal der primäre Aktivitätstreiber ist
- Weitere für Ihre Branche oder Ihren Berichtsrahmen relevante Unternehmenskennzahlen
- Intensitätstrends im Jahresvergleich, damit Wachstum und Emissionsreduzierung gemeinsam nachverfolgt werden können
Dies ist besonders wertvoll für Unternehmen, deren Stakeholder die Emissionsleistung im Kontext des Geschäftswachstums sehen möchten.
Buchen Sie Ihr kostenloses Erstgespräch
Möchten Sie lieber eine Nachricht hinterlassen?
Füllen Sie das Formular hier aus


Mehr zum Thema Reduzierung
Weitere Funktionen, die Sie auf dem Weg zu Netto-Null unterstützen.
Was unsere Kunden sagen
Don't just take our word for it...





.svg)



.svg)



Bereit für den Start?

Buchen Sie noch heute eine Demo mit einem unserer Experten oder legen Sie sofort kostenlos los.
FAQs
Ihre Fragen beantwortet
Was ist ein CO2-Emissions-Dashboard und was sollte es anzeigen?
Ein CO2-Emissions-Dashboard ist eine zentrale Übersicht der Treibhausgasdaten eines Unternehmens, die in der Regel Scope-1-, 2- und 3-Emissionen umfasst, aufgeschlüsselt nach Kategorie, Quelle und Zeitraum. Ein nützliches Dashboard geht über bloße Gesamtzahlen hinaus und zeigt auf, wo Emissionen konzentriert sind, wie sie sich im Zeitverlauf verändern und wie sie im Vergleich zwischen Standorten oder Geschäftsbereichen abschneiden. Unser Dashboard aktualisiert sich automatisch, sobald neue Daten hinzugefügt werden, sodass die Ansicht immer auf dem neuesten Stand ist.
Was ist der Unterschied zwischen Scope-1-, 2- und 3-Emissionen?
Scope 1 umfasst direkte Emissionen aus Quellen, die Ihr Unternehmen besitzt oder kontrolliert, wie z. B. Firmenfahrzeuge und Verbrennungsprozesse vor Ort. Scope 2 umfasst indirekte Emissionen aus eingekauftem Strom, Wärme oder Dampf. Scope 3 umfasst alle anderen indirekten Emissionen entlang Ihrer Wertschöpfungskette, einschließlich Geschäftsreisen, Lieferkette, Abfall und Produktnutzung. Für die meisten Unternehmen macht Scope 3 den größten Teil ihres Fußabdrucks aus und ist am komplexesten zu messen und zu reduzieren.
Wie funktionieren CO2-Intensitätskennzahlen und warum sind sie wichtig?
CO2-Intensitätskennzahlen setzen Emissionen ins Verhältnis zu einer betrieblichen Leistungskennzahl, wie etwa Umsatz oder Mitarbeiterzahl, anstatt sie als absoluten Gesamtwert anzugeben. Dies ermöglicht es Unternehmen nachzuverfolgen, ob sie im Laufe der Zeit CO2-effizienter werden, selbst wenn sie wachsen. Intensitätskennzahlen sind zudem eine Anforderung bestimmter SBTi-Methoden und werden zunehmend von Investoren und ESG-Ratingagenturen gefordert, die den Fortschritt bei der Dekarbonisierung bewerten.
Wie kann ich die größten Emissionsquellen in meinem Unternehmen identifizieren?
Beginnen Sie mit einer vollständigen Bilanz der Scope-1-, 2- und 3-Emissionen, aufgeschlüsselt nach Kategorien. In den meisten Unternehmen entfällt der Großteil der Emissionen auf eine kleine Anzahl von Kategorien, häufig Energie, Fracht, Geschäftsreisen oder eingekaufte Waren. Unser Dashboard markiert diese Hotspots automatisch, sodass Sie Ihre Reduzierungsbemühungen dort konzentrieren können, wo sie die größte Wirkung erzielen, anstatt Ihre Aufmerksamkeit gleichmäßig auf alle Emissionsquellen zu verteilen.
Haben Sie noch Fragen?
Buchen Sie eine Demo oder kontaktieren Sie uns – wir helfen Ihnen gerne weiter.
.svg)