Analyse granulaire des émissions
La confiance de plus de 500 entreprises à travers le monde










Analyse approfondie de vos principales sources d'émissions
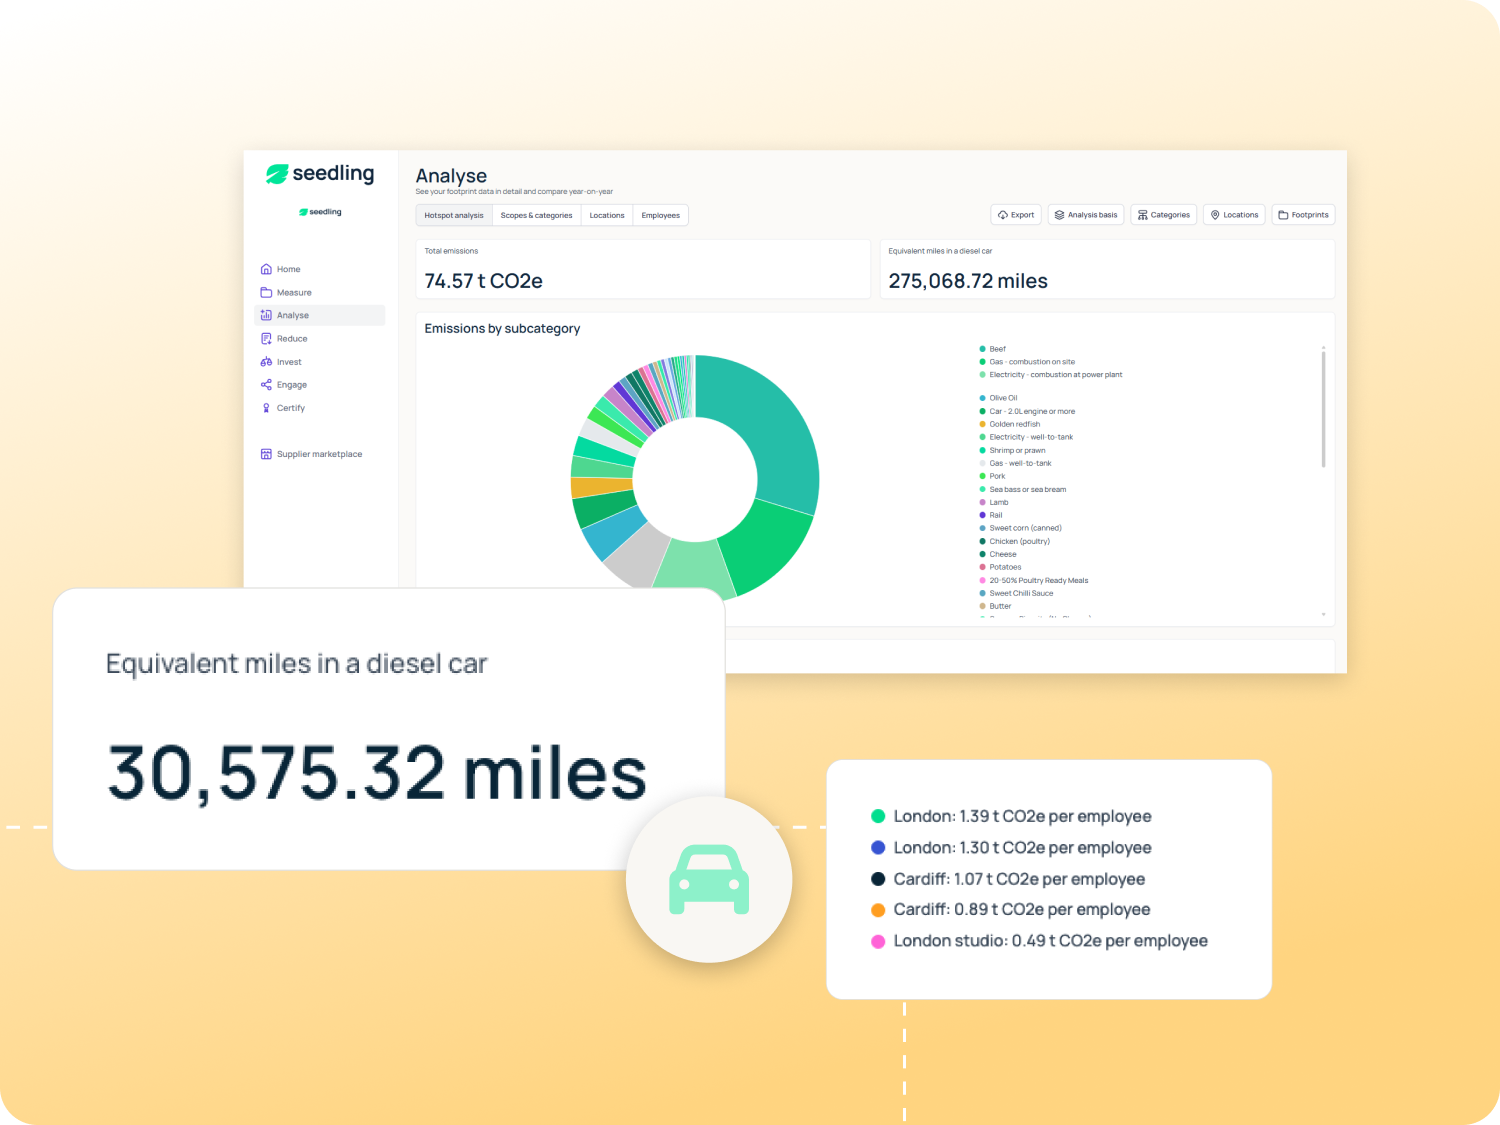
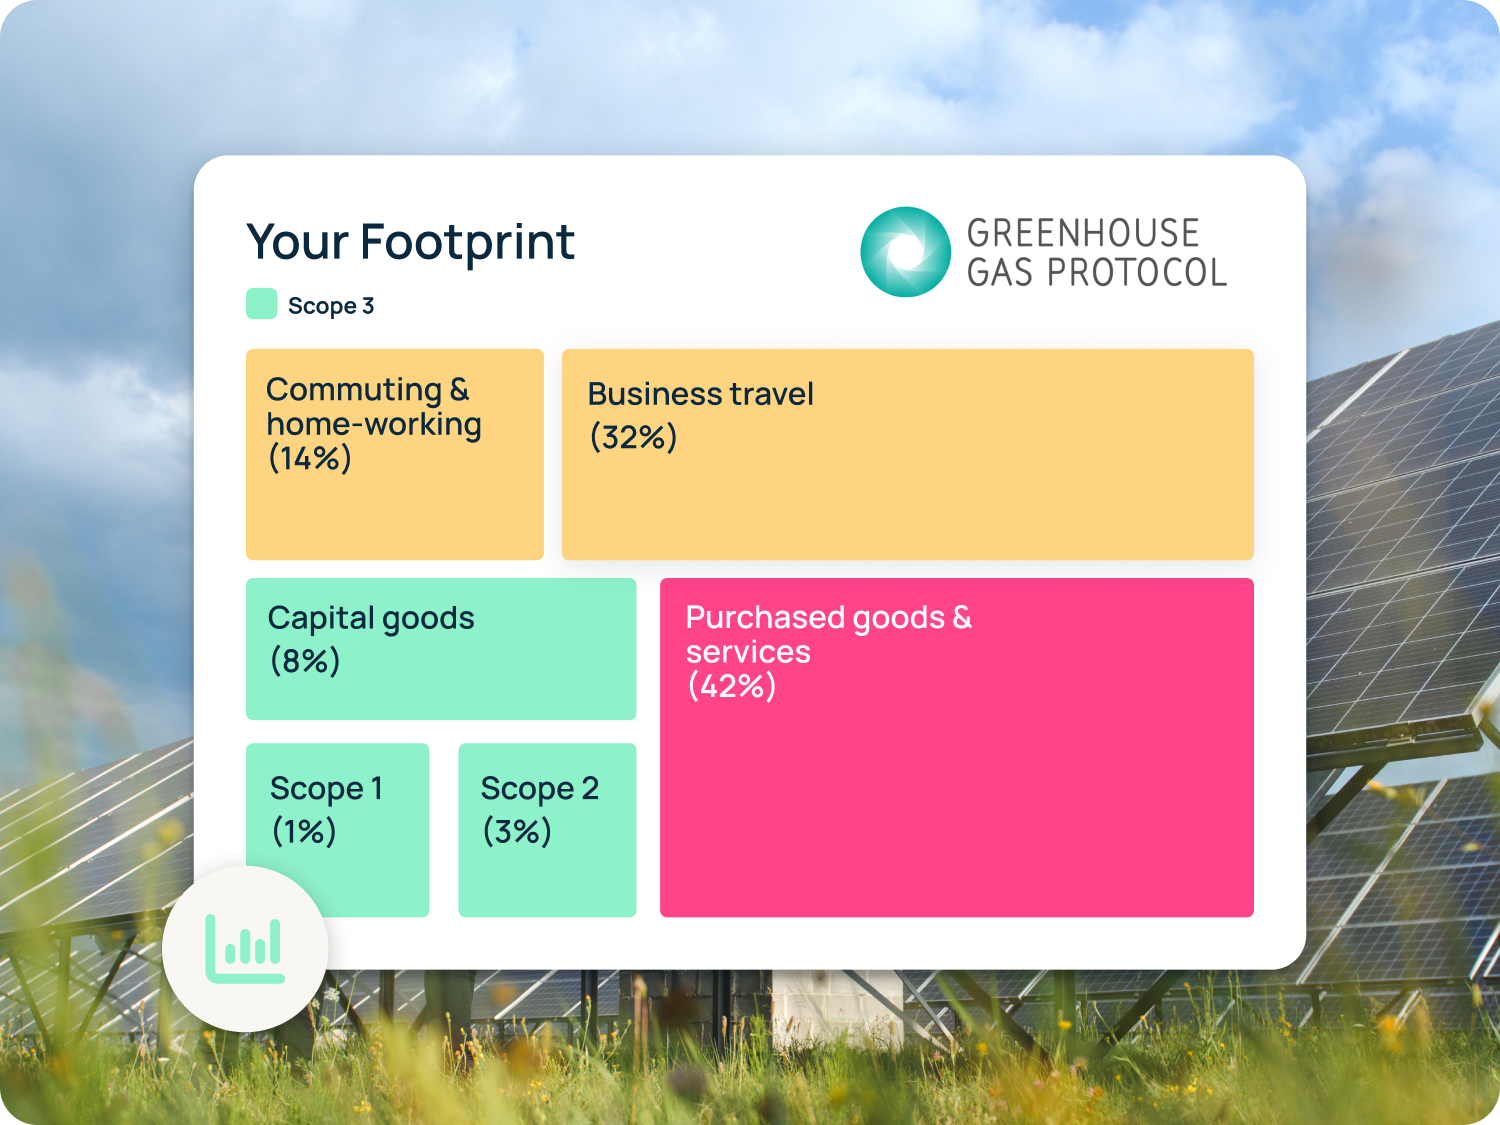
Votre tableau de bord s'ouvre sur une vue d'ensemble claire de vos émissions par scope, puis vous permet d'aller plus loin. À chaque niveau, vous pouvez visualiser la répartition des émissions selon les scopes 1, 2 et 3 ainsi que les catégories du GHG Protocol, et accéder à des analyses détaillées couvrant des milliers de sources d'émissions.
Analyse des points critiques pour cibler vos efforts de réduction
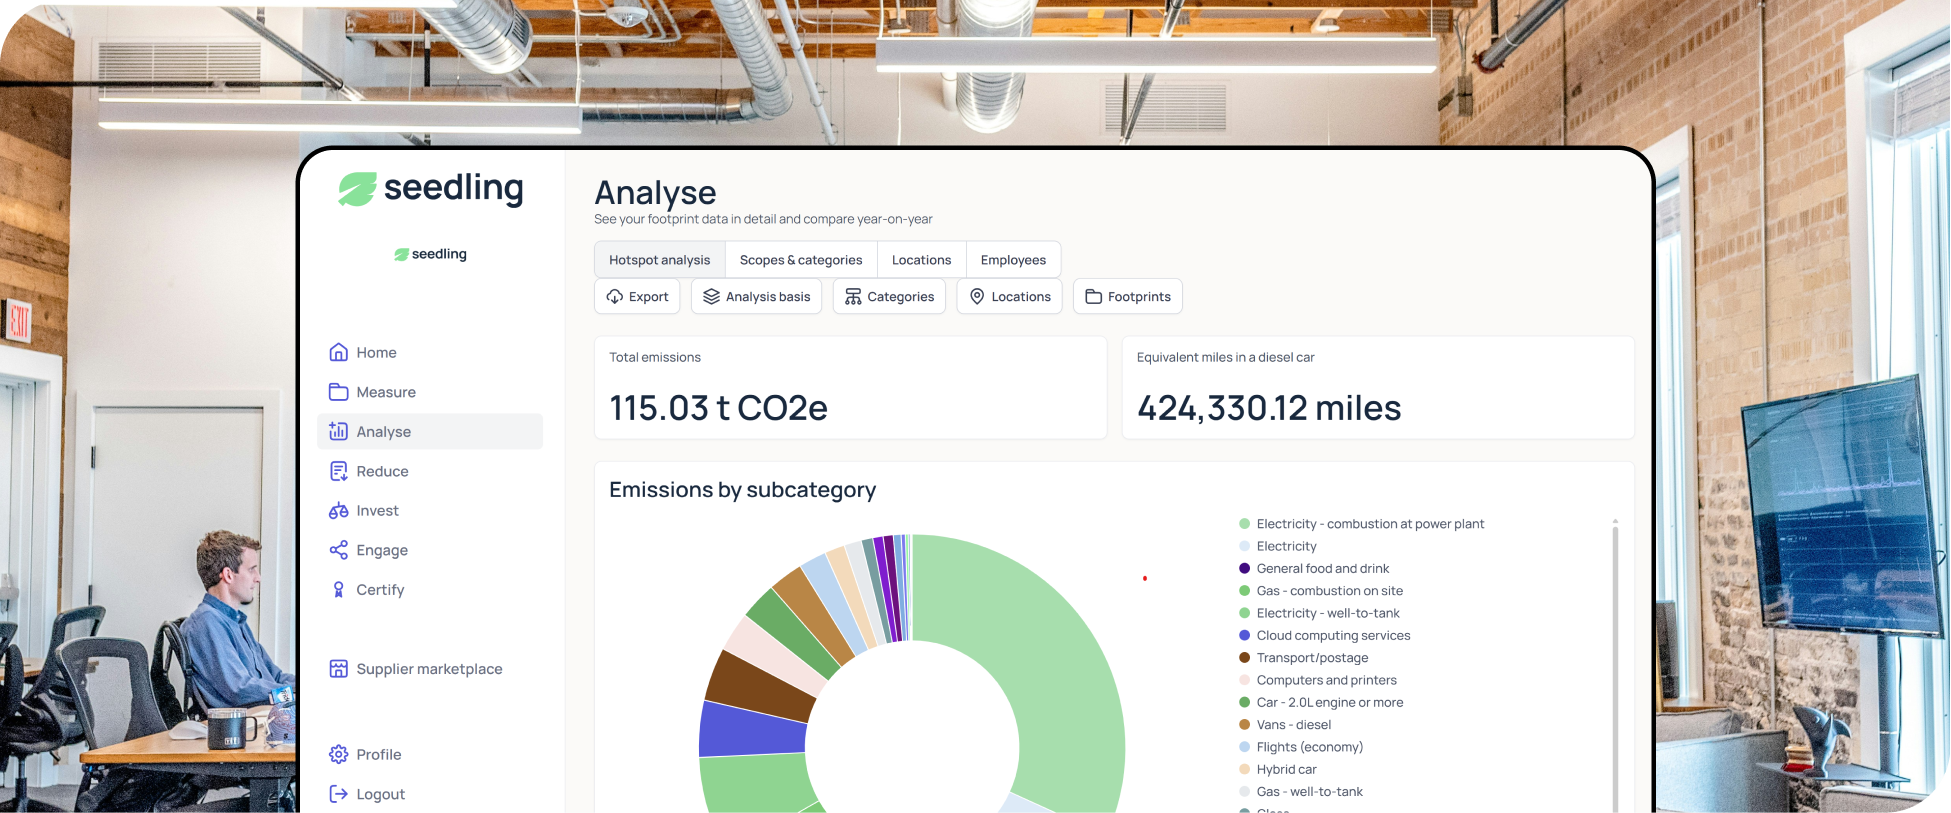
Connaître votre empreinte totale est une chose. Identifier les catégories qui la génèrent est ce qui rend la planification de la réduction efficace. Le tableau de bord met automatiquement en évidence vos points critiques d'émissions, vous permettant de voir :
- Quelles catégories représentent la plus grande part de votre empreinte pour chaque scope
- Où les émissions augmentent le plus rapidement, en signalant les domaines qui nécessitent une attention particulière avant qu'ils ne deviennent plus difficiles à traiter
- Comment les points critiques individuels se comparent aux références du secteur, pour donner du contexte à vos chiffres
- Quels domaines offrent les meilleures opportunités de réduction par rapport au coût et aux efforts nécessaires
Cela permet d'aller à l'essentiel. Plutôt que de traiter chaque source d'émission de la même manière, votre équipe peut concentrer son temps, son budget et ses engagements auprès des fournisseurs sur les domaines qui auront le plus d'impact.

Analyse basée sur l'intensité pour suivre les émissions au rythme de la croissance de votre entreprise
Les émissions absolues ne racontent qu'une partie de l'histoire. Les indicateurs d'intensité vous indiquent l'efficacité de votre entreprise par rapport à sa taille. Le tableau de bord vous permet d'analyser les émissions par rapport à :
- Le chiffre d'affaires, en suivant les tCO2e par million de devise de chiffre d'affaires pour surveiller l'efficacité carbone à mesure que vous vous développez
- L'effectif, utile pour les entreprises de services où les collaborateurs sont le principal moteur de l'activité
- Autres indicateurs commerciaux pertinents pour votre secteur ou votre cadre de reporting
- Tendances d'intensité d'une année sur l'autre, permettant de suivre simultanément la croissance et la réduction des émissions
Ceci est particulièrement utile pour les entreprises dont les parties prenantes souhaitent évaluer la performance en matière d'émissions dans le contexte de la croissance de l'activité.
Réservez votre appel découverte gratuit
Vous préférez laisser un message ?
Remplissez le formulaire ici


Plus dans Réduction
D'autres fonctionnalités pour vous aider à progresser sur la voie du Net Zéro.
Ce que nos clients disent
Don't just take our word for it...


.png)




.png)


Prêt à vous lancer ?

Réservez une démo avec l'un de nos experts dès aujourd'hui, ou lancez-vous gratuitement sans attendre.
FAQ
Vos questions, nos réponses
Qu'est-ce qu'un tableau de bord des émissions de carbone et que doit-il afficher ?
Un tableau de bord des émissions de carbone est une vue centralisée des données sur les gaz à effet de serre d'une entreprise, couvrant généralement les émissions des scopes 1, 2 et 3, ventilées par catégorie, source et période. Un tableau de bord utile va au-delà des totaux : il montre où les émissions sont concentrées, comment elles évoluent dans le temps et comment elles se comparent entre les sites ou les unités commerciales. Le nôtre se met à jour automatiquement à mesure que de nouvelles données sont ajoutées, garantissant ainsi une vue toujours actuelle.
Quelle est la différence entre les émissions des scopes 1, 2 et 3 ?
Le scope 1 couvre les émissions directes provenant de sources que votre entreprise possède ou contrôle, telles que les véhicules de société et la combustion sur site. Le scope 2 couvre les émissions indirectes liées à l'achat d'électricité, de chaleur ou de vapeur. Le scope 3 couvre toutes les autres émissions indirectes de votre chaîne de valeur, notamment les voyages d'affaires, la chaîne d'approvisionnement, les déchets et l'utilisation des produits. Pour la plupart des entreprises, le scope 3 représente la part la plus importante de leur empreinte carbone et la plus complexe à mesurer et à réduire.
Comment fonctionnent les indicateurs d'intensité carbone et pourquoi sont-ils importants ?
Les indicateurs d'intensité carbone expriment les émissions par rapport à une mesure de la production de l'entreprise, comme le chiffre d'affaires ou l'effectif, plutôt que sous forme de total absolu. Cela permet aux entreprises de suivre si elles deviennent plus efficaces en termes de carbone au fil du temps, même pendant leur croissance. Les indicateurs d'intensité sont également une exigence de certaines méthodologies SBTi et sont de plus en plus demandés par les investisseurs et les agences de notation ESG qui évaluent les progrès de la décarbonation.
Comment puis-je identifier les plus grandes sources d'émissions de mon entreprise ?
Commencez par une empreinte complète des scopes 1, 2 et 3 ventilée par catégorie. Dans la plupart des entreprises, un petit nombre de catégories, souvent l'énergie, le fret, les voyages d'affaires ou les biens achetés, représentent la majorité des émissions. Notre tableau de bord signale automatiquement ces points chauds, afin que vous puissiez concentrer vos efforts de réduction là où ils auront le plus grand impact, plutôt que de disperser votre attention sur chaque source d'émission.
Vous avez encore des questions ?
Réservez une démo ou contactez-nous, nous serons ravis de vous aider.
.svg)