Tableau de bord d'impact partageable
La confiance de plus de 500 entreprises à travers le monde










Toute votre action climatique, centralisée
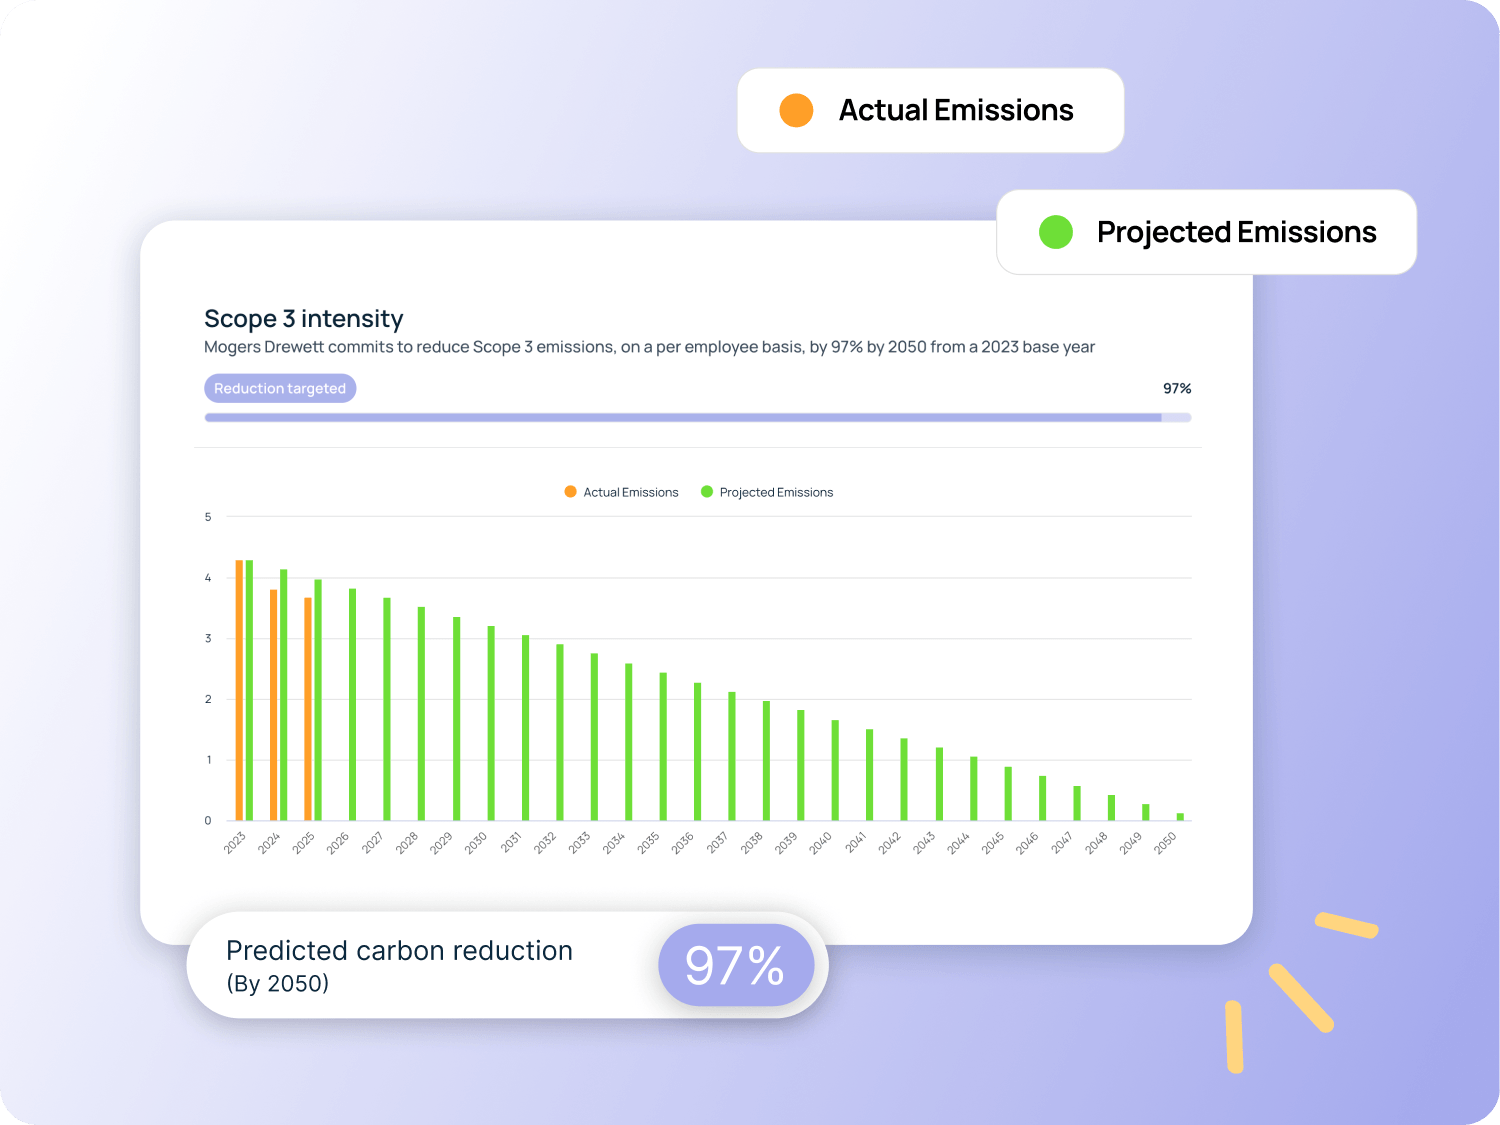
Le tableau de bord d'impact rassemble les résultats clés de la plateforme dans une vue unique et lisible, couvrant vos émissions, vos objectifs, votre plan de réduction et les projets de compensation dans lesquels vous avez investi.
.png)
Des rapports dynamiques, partageables au même endroit
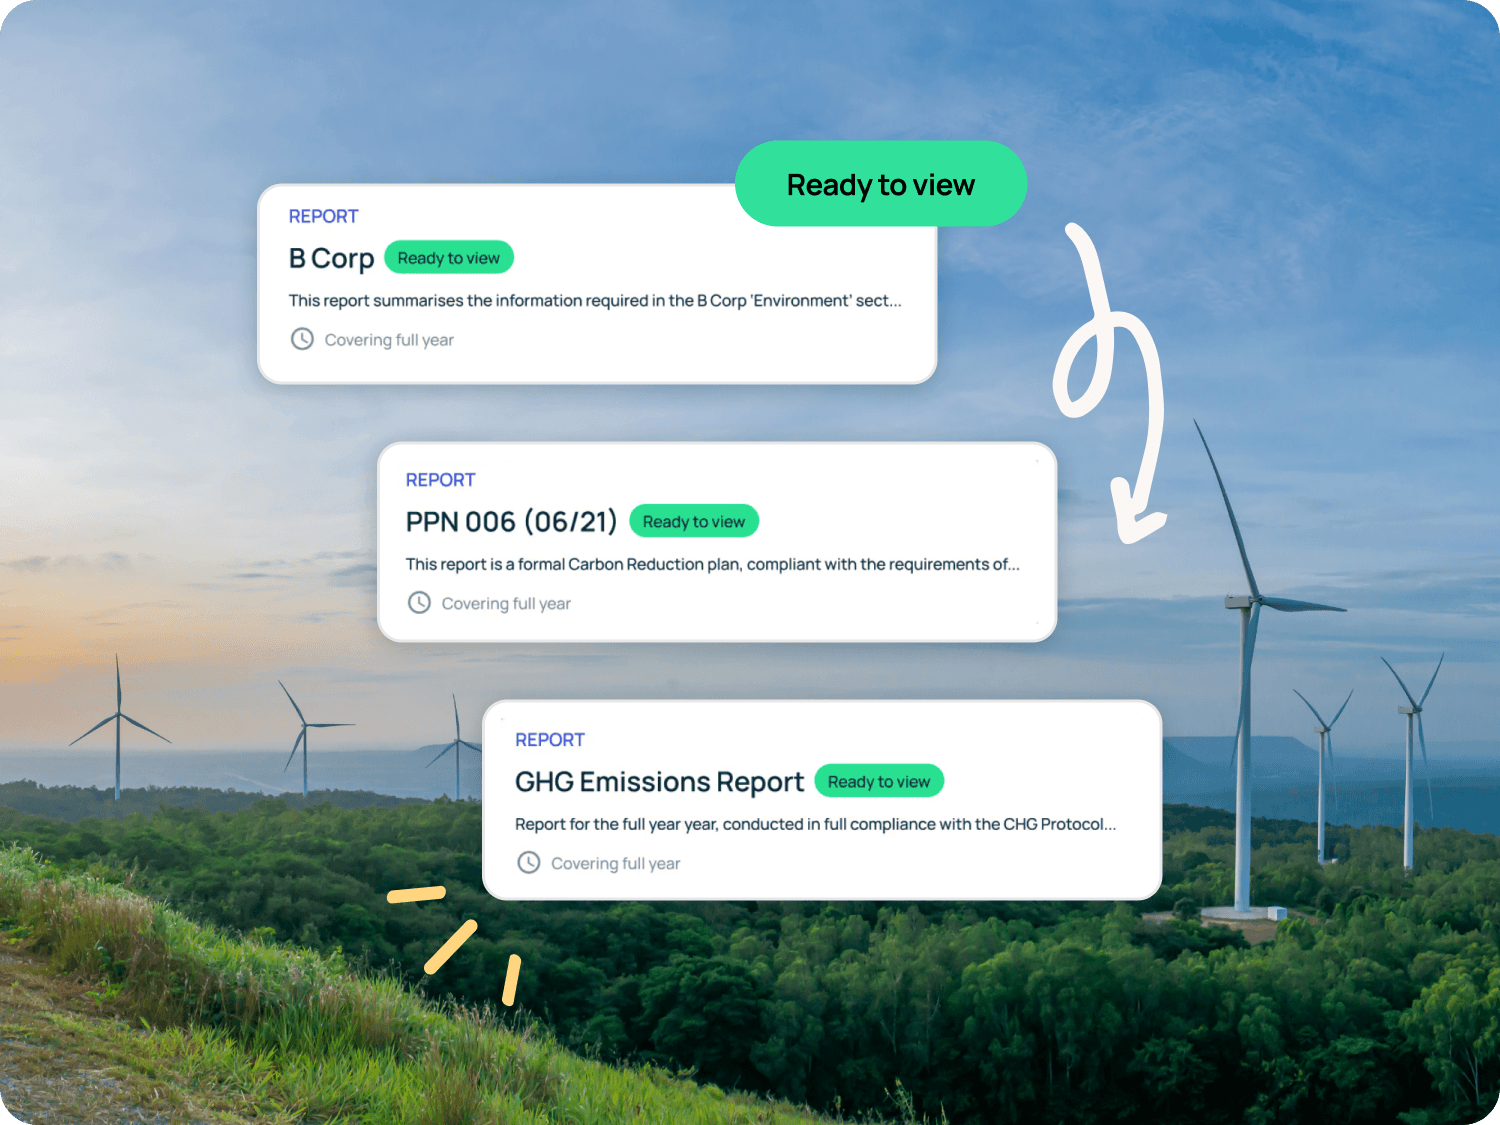
En plus de votre synthèse, le tableau de bord d'impact offre aux parties prenantes un accès direct à vos rapports officiels. Depuis un seul endroit, elles peuvent consulter :
- Votre rapport de synthèse GES et tout autre rapport conforme aux cadres de référence que vous avez publiés
- Des plans de réduction carbone prêts pour les achats et les soumissions d'appels d'offres
- La documentation de votre feuille de route Net Zéro destinée aux investisseurs ou aux conseils d'administration
- Toute autre divulgation que vous choisissez de rendre accessible
Les rapports sont présentés en temps réel plutôt que sous forme de pièces jointes statiques ; la version consultée par les parties prenantes est donc toujours à jour, éliminant tout risque d'utilisation de documents obsolètes.
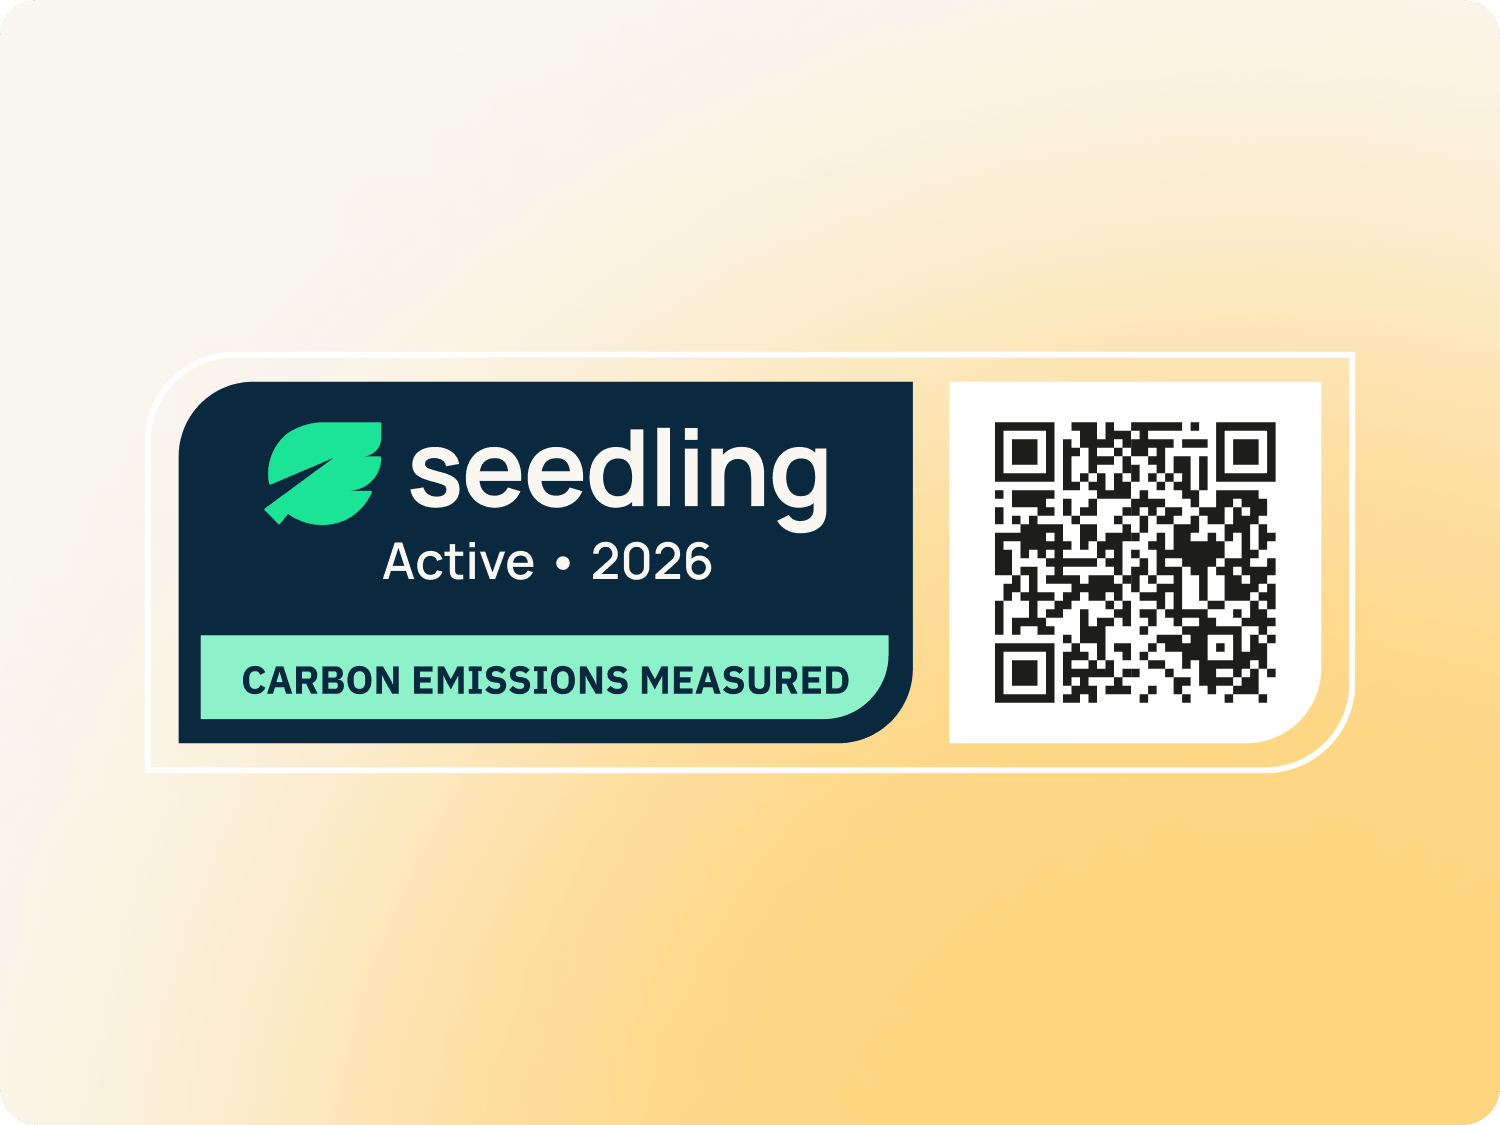
Partagez-le comme vous le souhaitez, via un lien, un code QR ou un widget intégré
Le tableau de bord d'impact est conçu pour s'intégrer à vos méthodes de communication habituelles avec les acteurs clés de votre entreprise :
- Partagez un lien direct dans vos e-mails, propositions, soumissions d'appels d'offres ou communications aux investisseurs
- Générez un code QR pour vos supports imprimés, stands d'événements, affichages au bureau ou emballages de produits
- Intégrez le tableau de bord sous forme de widget sur votre site web pour rendre vos références climatiques visibles par tous vos visiteurs.
- Contrôlez ce qui est rendu public et ce qui nécessite un partage direct, afin de garder les données sensibles en interne si nécessaire.
Que vous répondiez à la question d'un client, intégriez un nouveau fournisseur ou présentiez vos références lors d'un événement professionnel, votre tableau de bord d'impact est prêt à être partagé en quelques secondes.
Réservez votre appel découverte gratuit
Vous préférez laisser un message ?
Remplissez le formulaire ici


Plus d'options dans le module d'engagement
Découvrez nos autres fonctionnalités conçues pour vous aider à impliquer facilement vos clients, vos employés et vos autres parties prenantes dans votre démarche.
Ce que nos clients disent
Don't just take our word for it...






.png)





Prêt à vous lancer ?

Réservez une démo avec l'un de nos experts dès aujourd'hui, ou lancez-vous gratuitement sans attendre.
FAQ
Vos questions, nos réponses
Comment partager les références de durabilité de mon entreprise avec mes clients et investisseurs ?
L'approche la plus efficace consiste à fournir un résumé vérifié et actualisé regroupant vos données d'émissions, vos objectifs et vos actions de réduction en un seul endroit, plutôt que de rassembler des documents à chaque demande. Votre tableau de bord d'impact effectue cette tâche automatiquement. Partagez-le via un lien direct, générez un code QR ou intégrez-le à votre site web pour que chaque partie prenante puisse accéder instantanément à votre position climatique.
Que doit inclure un tableau de bord de durabilité d'entreprise ?
Au minimum, un tableau de bord de durabilité utile doit présenter les émissions actuelles par périmètre, les progrès réalisés par rapport aux objectifs de réduction et un résumé des actions entreprises pour réduire l'empreinte carbone. Les versions plus complètes incluent également des rapports officiels, les activités de compensation et des liens vers des documents justificatifs. Le nôtre centralise automatiquement toutes ces informations à partir des données vérifiées de votre plateforme, éliminant ainsi toute saisie manuelle.
Puis-je intégrer un résumé de mon empreinte carbone sur le site web de mon entreprise ?
Oui. Votre tableau de bord d'impact peut être intégré directement sur votre site web sous forme de widget, offrant aux visiteurs une vue en temps réel de vos données d'émissions, de vos objectifs et de vos actions climatiques sans qu'ils aient à quitter votre site. Le widget se met à jour automatiquement au rythme de vos données, vous évitant ainsi toute mise à jour manuelle ou risque d'afficher des chiffres obsolètes.
En quoi un tableau de bord d'impact partageable diffère-t-il d'un rapport de durabilité statique ?
Un rapport statique est une photographie prise à un instant T, qui devient obsolète dès que la situation évolue. Votre tableau de bord d'impact est une vue dynamique qui reflète en permanence vos données actuelles, vos objectifs actifs et vos derniers rapports. Il est également beaucoup plus simple à partager et à consulter, supprimant le besoin d'envoyer des documents par e-mail, de gérer des versions de fichiers ou de renvoyer les parties prenantes vers de multiples sources pour obtenir différentes informations.
Vous avez encore des questions ?
Réservez une démo ou contactez-nous, nous serons ravis de vous aider.
.svg)