Shareable Impact Dashboard
Trusted By 500+ businesses around the world











.svg)





All of your climate action, in one place
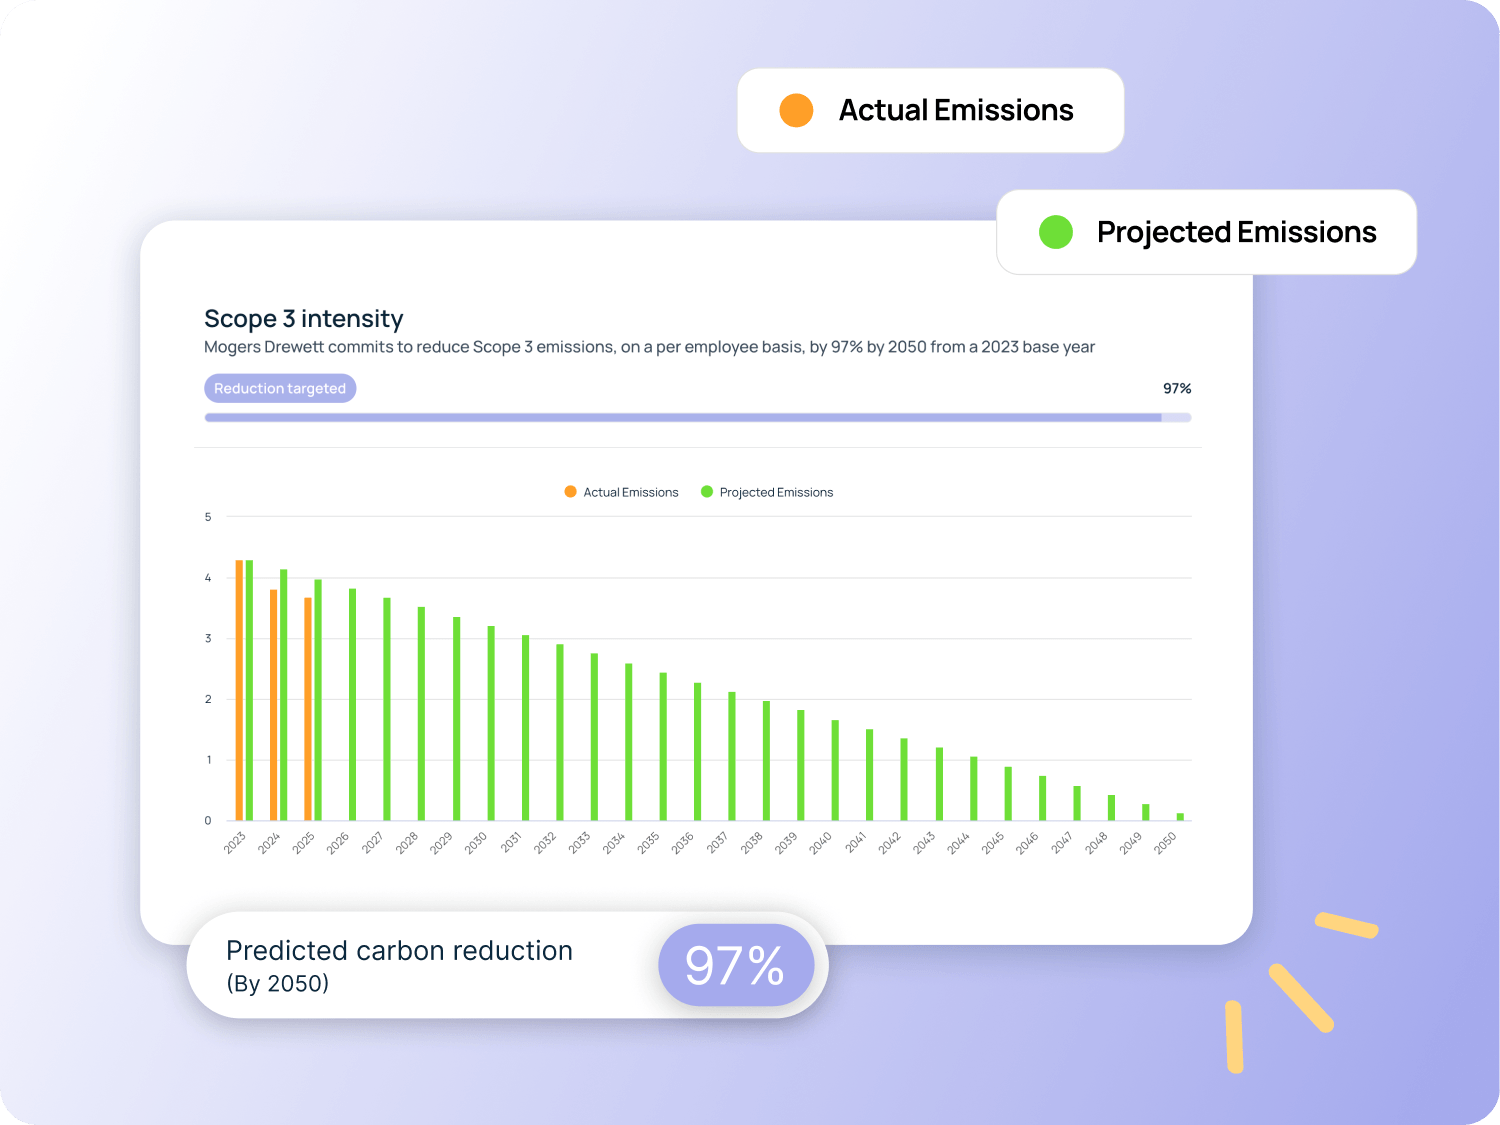
The Impact Dashboard brings together the key outputs from across the platform into a single, readable view, covering your emissions, targets, reduction plan and any offsetting projects you've invested in.
.png)
Live reports, shareable in the same place
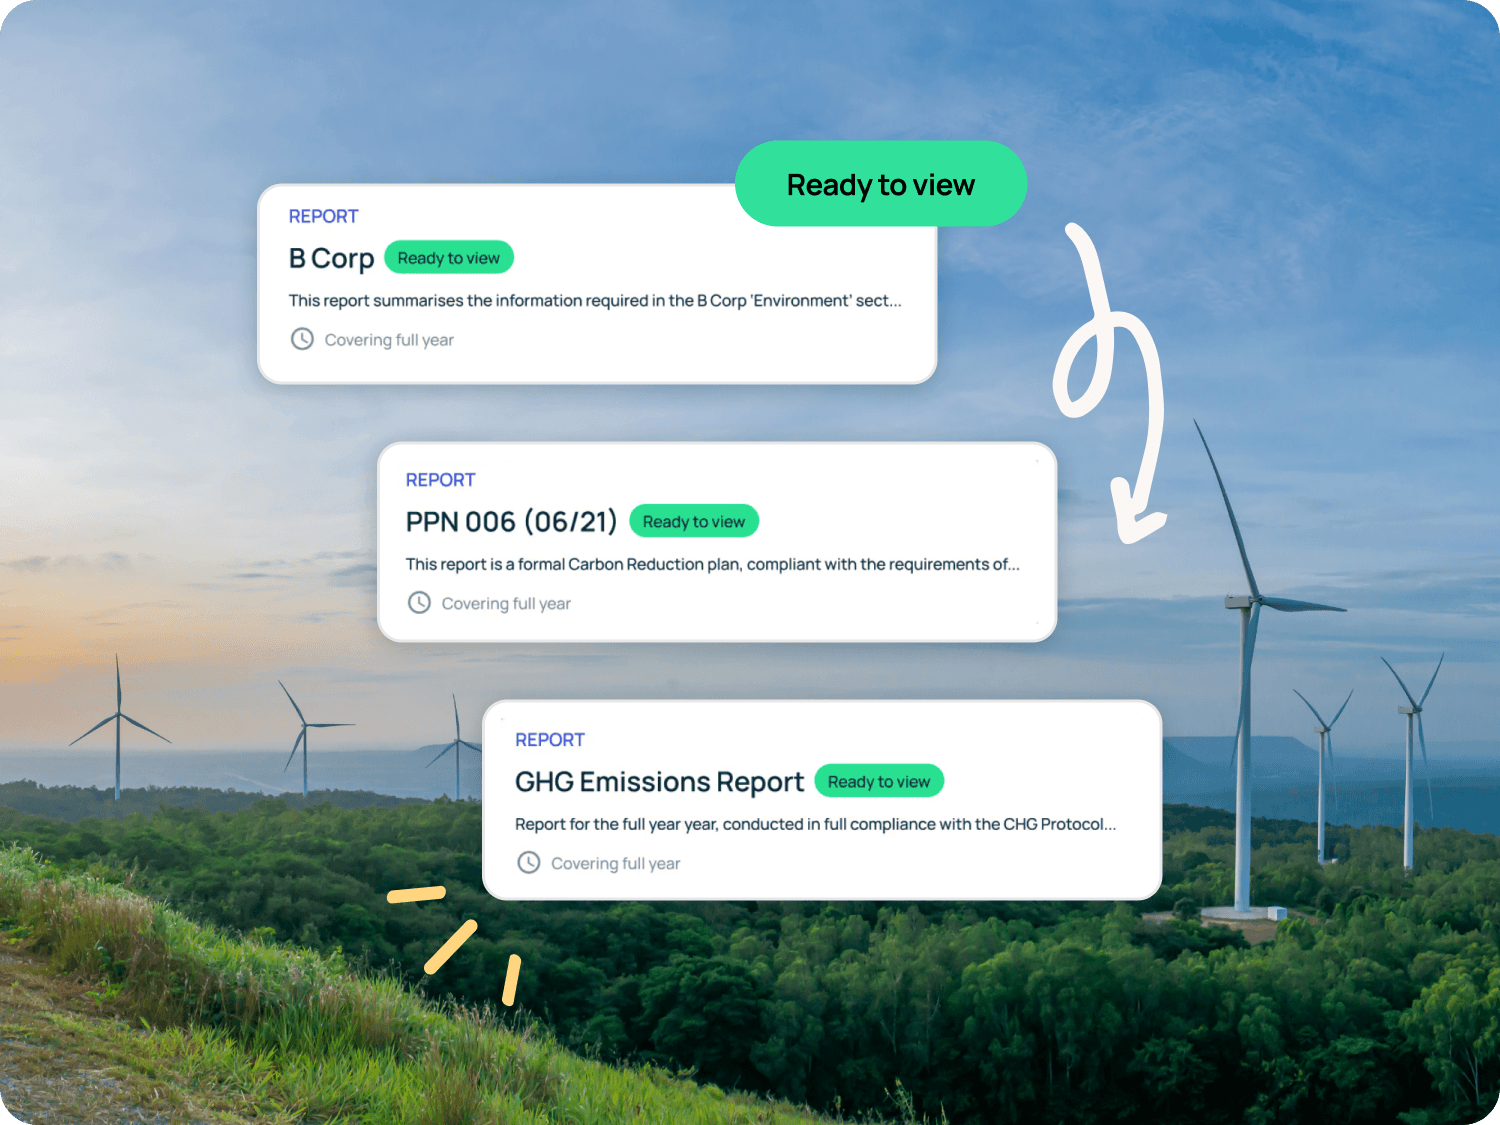
As well as your summary, the Impact Dashboard gives stakeholders direct access to your formal reports. From one place they can view:
- Your GHG Summary Report and any other framework-aligned reports you have published
- Carbon Reduction Plans ready for procurement and tender submissions
- Net zero roadmap documentation for investor or board-level audiences
- Any other disclosures you choose to make available
Reports are presented live rather than as static attachments, so the version a stakeholder sees is always current and there is no risk of someone working from an outdated document.
Share it your way, via link, QR code or embedded widget
The Impact Dashboard is built to fit into how you already communicate with the people who matter to your business:
- Share a direct link in emails, proposals, tender submissions or investor communications
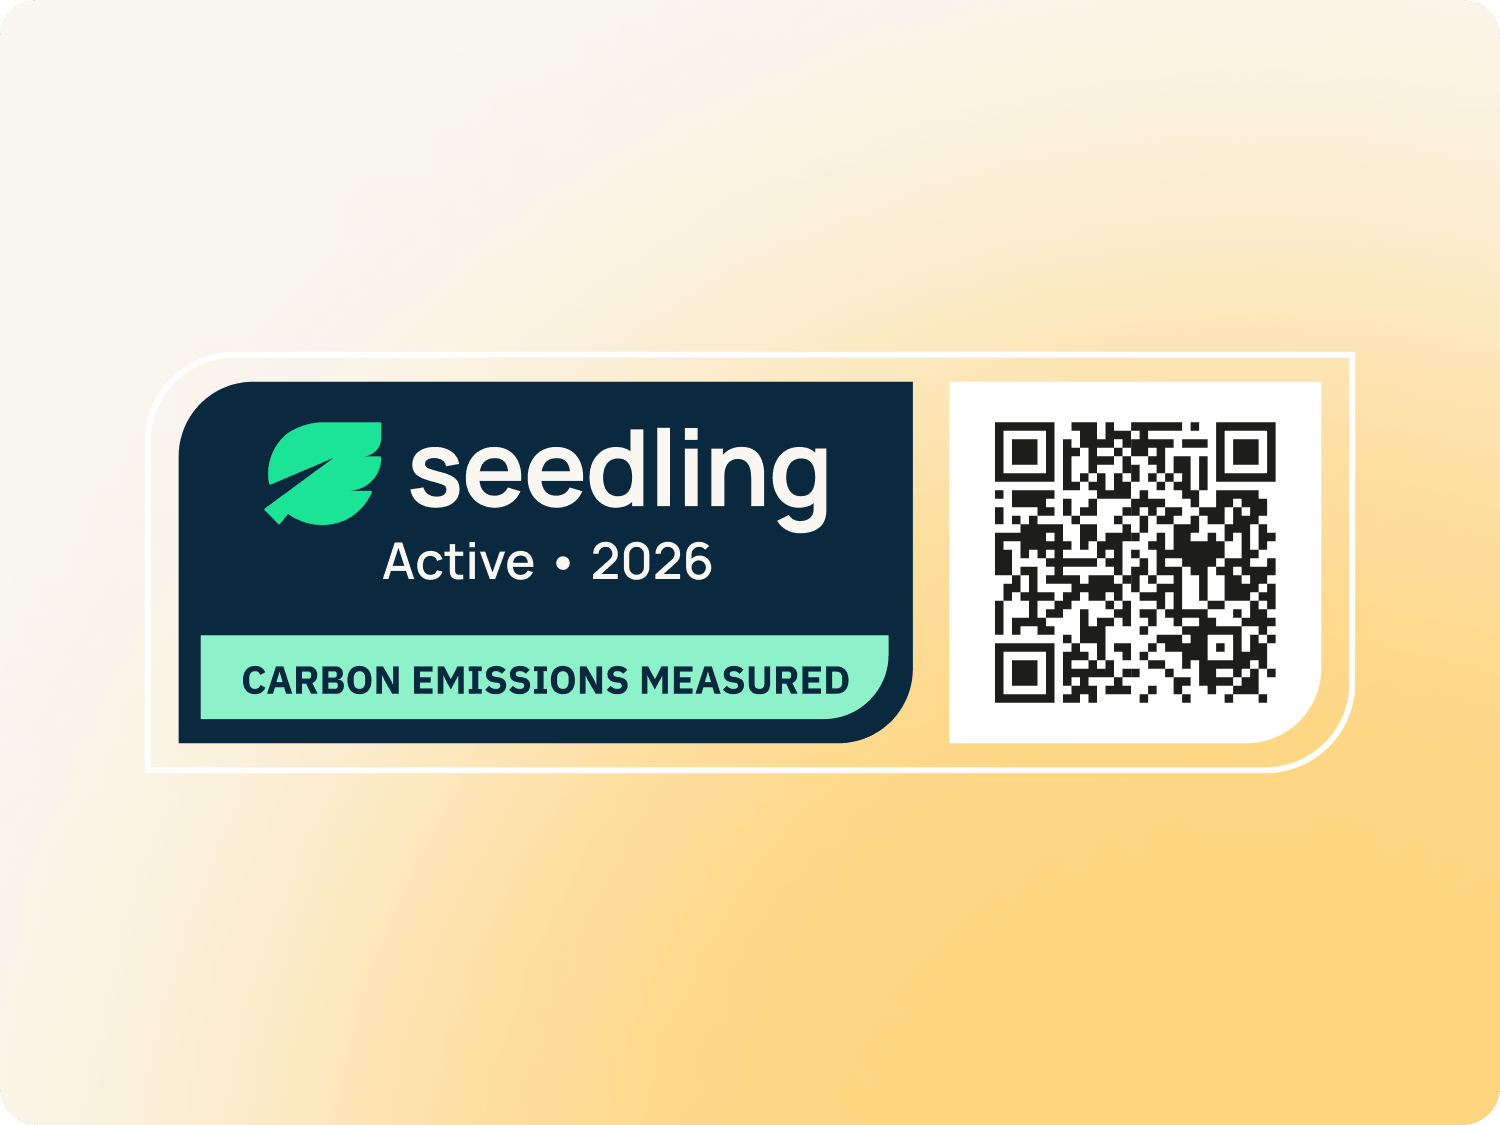
- Generate a QR code for print materials, event stands, office displays or product packaging
- Embed the dashboard as a widget on your website, so your climate credentials are visible to anyone who visits
- Control what is publicly visible and what requires a direct share, keeping sensitive data internal where needed
Whether you are responding to a client question, onboarding a new supplier or demonstrating your credentials at an industry event, your Impact Dashboard is ready to share in seconds.
Book Your Free Discovery Call


More Within Engage
See our other features that make it easy for you to bring your clients, employees and other stakeholders on the journey.
What our clients say
Don't just take our word for it...






Ready to get started?

Book a demo with one of our experts today, or get started right away for free.
FAQs
Your questions answered
How do I share my company's sustainability credentials with clients and investors?
The most effective approach is a verified, up-to-date summary that covers your emissions data, targets and reduction activity in one place, rather than assembling documents each time someone asks. Your Impact Dashboard does this automatically. Share it via a direct link, generate a QR code or embed it on your website, and every stakeholder who needs to see your climate position can access it immediately.
What should a business sustainability dashboard include?
At minimum, a useful sustainability dashboard should show current emissions by scope, progress against reduction targets and a summary of the actions being taken to reduce the footprint. Stronger versions also include formal reports, offsetting activity and links to supporting documentation. Ours pulls all of this together automatically from your verified platform data, so there is no manual assembly involved.
Can I embed a carbon footprint summary on my company website?
Yes. Your Impact Dashboard can be embedded directly on your website as a widget, giving visitors a live view of your emissions data, targets and climate action without leaving your site. The widget updates automatically as your platform data changes, so you never need to update it manually or worry about displaying out-of-date figures.
How is a shareable Impact Dashboard different from a static sustainability report?
A static report is a snapshot produced at a point in time, which becomes outdated as soon as something changes. Your Impact Dashboard is a live view, always reflecting your current data, active targets and latest reports. It is also far easier to share and access, removing the need to email documents, manage file versions or direct stakeholders to multiple sources for different pieces of information.
Still have questions?
Book a demo or get in touch and we'll be happy to help.
.svg)