

.png)
Introduction: what a business carbon footprint actually is
A business carbon footprint is the sum of all greenhouse gas emissions a company is responsible for in a given year. It is counted in tonnes of carbon dioxide equivalent, or tCO₂e. The most widely used framework is the Greenhouse Gas Protocol. It splits emissions into three scopes so you can see where impacts occur and who controls them:
- Scope 1: direct fuel the business burns. Think gas in your boilers or diesel in your fleet.
- Scope 2: electricity, heat, steam or cooling you buy.
- Scope 3: everything else in your value chain. Purchased goods and services, freight, business travel, employee commuting and homeworking energy, waste, use of sold products, and more.
You can read more about business carbon footprinting and the Scopes here.
In the UK, small and mid-sized businesses make up the overwhelming majority of the business population and contribute a large share of economy-wide emissions. Treat that UK picture as indicative globally because business demographics skew similarly: lots of small firms, a small number of very large ones.
Why “average” is slippery: size, sector and method
A few points shape any conversation about an “average” carbon footprint.
- Size matters. Emissions scale with activity. Bigger businesses buy more goods, move more things and power more space. So comparisons are clearer when normalised: per full-time employee, per £ million revenue, or per unit produced. Many teams use both: per-employee is handy for service firms, while per-revenue makes sense where cost of goods drives footprint.
- Sector intensity varies. Services tend to be light on Scopes 1 and 2, and relatively heavier on Scope 3 from things like cloud, purchased services and travel. Manufacturers carry significant on-site energy plus supply chain emissions. Logistics businesses often have the most operational fuel use.
- Methods can distort. Two companies can look the same on paper and end up with very different numbers if one relies on different methods – for example, spend-based estimates vs. more accurate activity data. Spend-based approaches are useful for screening but can over or under-estimate, and they will move with inflation. Activity data grounded in real units and supplier specifics is more robust.
With those caveats, we can still build a practical picture of “average” per-employee footprints by sector. Treat the ranges below as directional, not precise. Geography, growth stage, outsourcing and product mix can push you to the low or high end.
Per-employee “average” carbon footprints by business model
Below, we progress from the least intensive to the most intensive. For each, we outline a typical per-employee range, break down the drivers by scope, and note what pushes a firm toward the bottom or top of that range. Use these ranges as sector benchmarks to understand whether you’re broadly above or below typical intensity before you dive into reduction planning. You can see a summary of this cross-sector comparison in the table below.
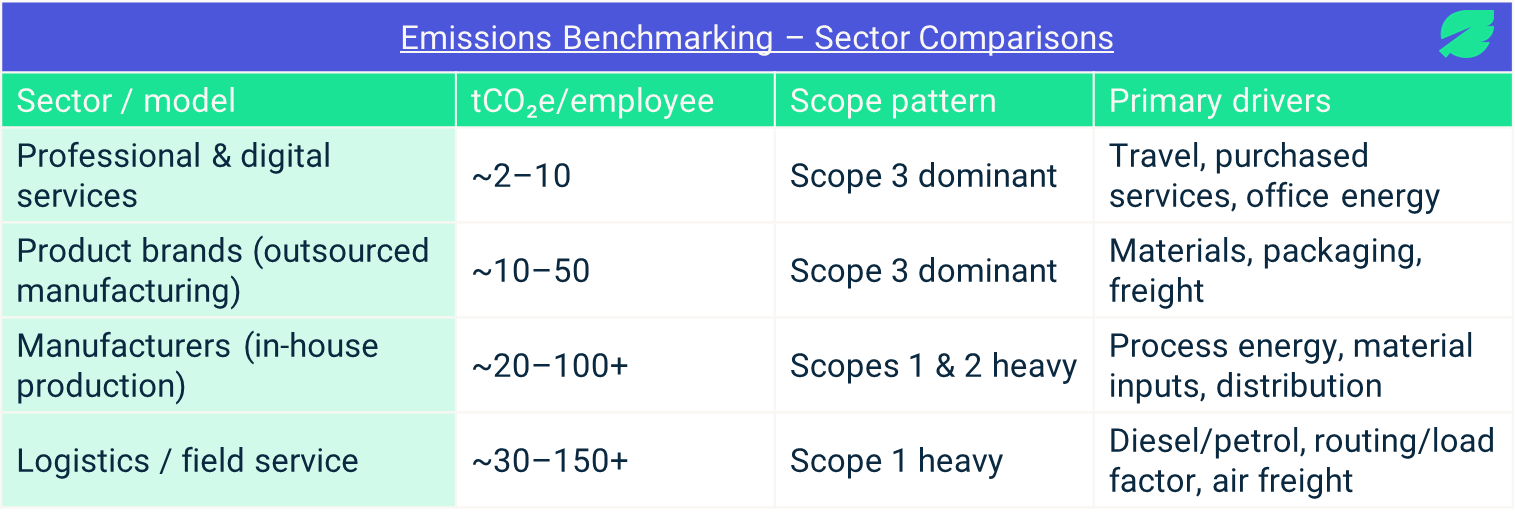
1) Professional and digital services
Indicative range: ~2–10 tCO₂e per employee
Where emissions sit:
- Scope 1: Usually minimal. Gas for a small office or car allowance miles if reimbursed as company fuel. Many service SMEs have zero Scope 1 if they lease space without direct fuel use.
- Scope 2: Office electricity for lighting, HVAC and IT. Fully remote teams may have near-zero Scope 2 at the company level because electricity is at home, not the office.
- Scope 3: Often the majority. Purchased services and software, employee commuting and homeworking energy, business travel, cloud computing, marketing, small amounts of waste and equipment. For some agencies and SaaS companies, Purchased Goods and Services dominates simply because most spend is on people and services.
What puts you at the low end:
- Lean office footprint or remote-first model.
- Renewable electricity in any offices or coworking spaces.
- Limited travel or strong use of trains over planes and cars, good virtual collaboration.
What pushes you up the range:
- Frequent short-haul and long-haul flights.
- Large, inefficient office space with old HVAC.
- High reliance on subcontracted services with carbon-intensive delivery, extensive hardware refresh cycles, or substantial spend on in-person marketing / events.
Typical split: Scope 1: 0–10%, Scope 2: 5–25%, Scope 3: 70–95%.
2) Product companies without in-house manufacturing (design, brand, wholesale, e-commerce)
Indicative range: ~10–50 tCO₂e per employee
Where emissions sit:
- Scope 1: Usually limited to office or small warehouse heating, plus any company vehicles.
- Scope 2: Electricity for offices and warehouses.
- Scope 3: The big one. Purchased Goods and Services dominates via materials, fabrication performed by suppliers, packaging, and upstream transportation. Downstream distribution, returns, and end-of-life can also be material. For apparel, for instance, raw fibre production and fabric processing carry significant impacts compared with a brand’s own office energy.
What puts you at the low end:
- Low-impact materials, recycled content, or engineered designs that reduce mass per unit.
- Supplier engagement to use renewable energy and efficient processes.
- Compact supply chains and ocean freight over air.
What pushes you up the range:
- Heavy, intensive materials or complex, multi-component products.
- Air freight usage, high return rates, or temperature-controlled logistics.
- Fast refresh cycles and high obsolescence in electronics or fashion.
Typical split: Scope 1: 0–10%, Scope 2: 5–20%, Scope 3: 70–95% with Purchased Goods and Services and transport as hotspots.
3) Manufacturers (in-house production)
Indicative range: widely variable by process, often ~20–100+ tCO₂e per employee
Where emissions sit:
- Scope 1: On-site fuel for process heat, steam, curing, drying, kilns, or combined heat and power. Process emissions for specific chemistries.
- Scope 2: Electricity for motors, compressors, chilled water, HVAC, and lighting. If you electrify heat, Scope 2 can rise as Scope 1 falls.
- Scope 3: Still large. Upstream materials, capital goods, inbound and outbound logistics, waste, and sometimes use-phase if your products draw power during their lifetime.
What puts you at the low end:
- Efficient processes, heat recovery, good maintenance and controls.
- High-recycled or lower-impact feedstocks.
- Renewable electricity, power-purchase agreements, or on-site solar.
What pushes you up the range:
- High-temperature processes, fossil-fuel-based heat or solvent use.
- Energy-intensive materials and high scrap rates.
- Frequent air freight for components or finished goods.
- Low plant utilisation that wastes energy per unit produced.
Typical split: Scope 1: 20–50%, Scope 2: 10–40%, Scope 3: 30–60% depending on process and material mix.
4) Logistics, transport and field-service fleets
Indicative range: ~30–150+ tCO₂e per employee, sometimes higher for heavy haulage
Where emissions sit:
- Scope 1: Dominant for diesel or petrol fleets. Fuel burned in owned or controlled vehicles can dwarf everything else.
- Scope 2: Becomes significant if you operate an electric fleet and large depots. Electricity for charging and buildings shows here.
- Scope 3: Upstream fuel or energy, vehicle manufacture (capital goods), third-party carriers, and maintenance.
What puts you at the low end:
- High vehicle utilisation, efficient routing and loading.
- Transition to EVs or alternative fuels where grid carbon is low.
- Aerodynamic and tyre upgrades, idle reduction, eco-driver training.
- Depot solar plus smart charging strategies.
What pushes you up the range:
- Older, less efficient vehicles and low load factors.
- Time-critical operations that require air freight or partial loads.
- Long routes in regions with high grid intensity.
Typical split:
ICE fleet: Scope 1 can exceed 80%.
Electric fleet on a green grid: Scope 2 may become the largest share, with Scope 1 shrinking sharply. Scope 3 remains material via embodied vehicle impacts and any outsourced legs.
5) Other sectors to consider
- Construction and the built environment. Ranges vary hugely. Site fuel and electricity drive Scopes 1 and 2. Materials like cement and steel drive Scope 3. Per-employee intensity can be high because a relatively small headcount manages large energy and materials flows via contractors and suppliers.
- Food and drink. Agricultural inputs and refrigeration push Scope 3 and Scope 2 higher. If you run commercial kitchens or cold storage, on-site energy can be substantial. Freight at controlled temperatures increases transport emissions.
- Healthcare and life sciences. Specialist equipment, HVAC for clean rooms, and cold chains raise Scopes 1 and 2. Capital goods and purchased services are big Scope 3 categories. Per-employee can skew high with small teams overseeing energy-intensive labs or facilities.
Why carbon footprint comparisons are hard, and how to make them fairer
Comparing footprints across businesses is tempting and often useful, but it is also easy to get wrong.
- Different boundaries: One company includes all relevant Scope 3 categories, another does not. The former will appear “worse” even if it is doing more of the right work.
- Methodology differences: Spend-based vs activity-based. Supplier-specific vs country averages. These choices can change results by tens of percent.
- Growth and mix: A fast-growing scale-up investing in equipment may look like it is going backwards on an absolute basis. In those cases, intensity metrics per employee or per revenue give a clearer view of directional improvement.
- Outsourcing: Two firms can deliver the same service with different in-house vs supplier mixes. Outsourcing often shifts impacts to Scope 3, not away from the business reality.
The remedy: be explicit about what you included, how you calculated it, and which year you are comparing. Document your data quality and assumptions.
Benchmark your business against sector averages (using per-employee numbers)
Now that you’ve seen how footprints vary by business model, treat those figures as benchmarks rather than targets. The goal is context: are you broadly in line with peers in your sector, and where are the biggest opportunities to improve?
How to use per-employee numbers for benchmarking
- Compare like-for-like. Use the same boundary, year, and method when you compare with peers. Switching between spend-based screening and activity/supplier data will move results and can muddy a benchmark.
- Use two lenses, not one. Track tCO₂e per employee (good for service firms) and tCO₂e per £ revenue (useful when cost of goods drives emissions). Together they show whether you’re decoupling growth from emissions.
- Look for outliers, not perfection. If your result sits well above your sector’s typical band, investigate obvious drivers (e.g., flights for services; materials, freight and returns for product; process heat for manufacturers; fuel/fleet mix for logistics). If you’re well below, double-check scope coverage and data quality before celebrating.
- Benchmark over time. For growing companies, absolute emissions may rise with headcount. A good benchmark practice is to improve your intensity metrics year-on-year while you work toward absolute cuts aligned with science-based pathways.
- Triangulate with peers. When possible, compare with businesses of similar size, geography and delivery model (e.g., in-house vs. outsourced production) to avoid apples-to-oranges conclusions.
What to do if you’re above your sector’s average
- Confirm scope coverage and method;
- Prioritise hotspots consistent with your model (e.g., travel and purchased services in professional services; materials and upstream logistics for product; process energy for manufacturing; fleet and routing/load factor for logistics);
- Set near-term actions and re-benchmark next reporting cycle.
Always keep the full picture in view. Your goal is to cut absolute emissions in line with science-based pathways while the business grows. Intensity metrics help you manage the journey.
Conclusion: there is no single “average” business, so build your own baseline
If you want one headline number, here it is: many service-led SMEs land around 2–10 tCO₂e per employee, product brands without in-house manufacturing around 10–50, manufacturers and logistics higher again. But the useful work starts when you go beyond a sector average and build a footprint that reflects your operations, your suppliers and your choices.
The key is a robust, full-scope assessment, transparent methods, and a plan you can execute. That is exactly what Seedling is built for: accurate measurement with adviser support, clear hotspot analysis, practical reduction planning, on-platform target setting, and credible reporting your clients and accreditors will recognise. If you want help turning “average” into your own baseline and action plan, we can get you there without the overwhelm.
Ready to see what your per-employee footprint looks like and where to cut it first? Book a quick intro and we’ll show you how the process works end-to-end.
Start Managing
Your Carbon Footprint
Today
Benchmark your business’s climate action for free


Ready to get started?

Book a demo with one of our experts today, or get started right away for free.
.svg)