

What are Scope 3 emissions?
Scope 3 emissions make up 80%+ of a typical business carbon footprint. Also known as value chain emissions, Scope 3 essentially captures everything beyond emissions from energy consumption. However, because Scope 3 stretches across diverse categories and data sources, it’s also the trickiest part to measure. This guide is here to help.
Focussing on the Big 4
This guide focuses on the four most common Scope 3 emission categories that apply to almost every business:
- Purchased Goods and Services
- Business Travel
- Employee Commuting & Working from Home
- Waste Generated in Operations
For each one, we break down exactly how to measure it: where to get your data, how to improve accuracy, and why accurate measurement is a core part of an effective Net Zero strategy.
Purchased Goods & Services
For many businesses, this is the biggest slice of your Scope 3 emission footprint. It can also be the hardest to measure accurately. Here’s a practical, step-by-step approach to get it right.
Step 1: Start with a Spend-Based Assessment
We’re going to create an initial estimate of the carbon footprint of the goods and services you purchase by translating your spend data – specifically the amount you spend by supplier – into a carbon footprint
- First, head to your accounting system (e.g. Xero, Sage) and export your spend by supplier for the reporting period. If you can, sort this list by your largest to smallest supplier
- Next, we’ll look to convert this spend data into carbon. To do this, you’ll need to match each supplier to an emissions factor for the type of good or service you purchased (e.g. IT, packaging, raw materials, and office supplies). Small World Consulting publishes a free spend-based dataset. You’ll see that these emissions factors calculate CO₂e values per £1 spent
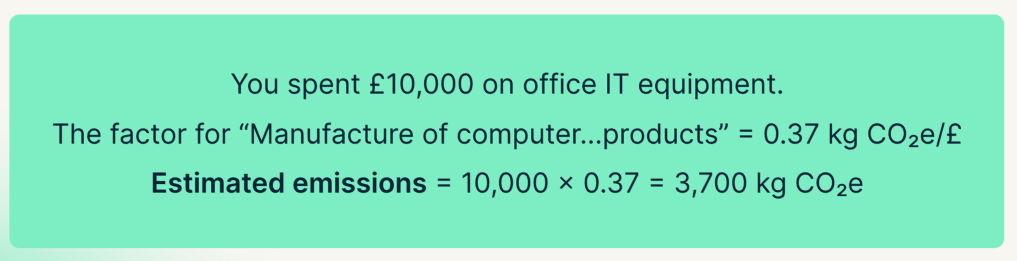
- Once you’ve categorised each supplier, multiply your spend with each supplier by the relevant emissions factor. Here’s an Example:
Note – company specific spend-based assessments
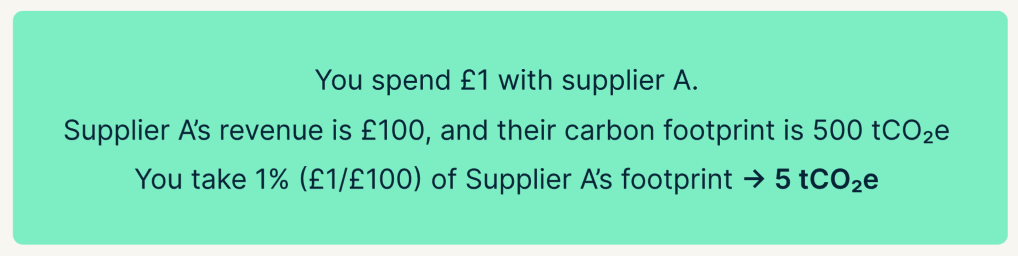
There is a second way to calculate emissions on a spend basis, and that’s by using company-level carbon data. This works by apportioning your supplier’s total carbon emissions to your business based on your share of spend with them. Here’s an example:
The problem with this methodology is that what you purchase from your supplier might not be representative of their product and service mix as a business. This is particularly the case when the supplier is a large, complex company.
Take Amazon as an example: your purchase might be a few electrical items, but Amazon’s total emissions also cover service lines unrelated to your purchase, like AWS and Prime Video for instance.
In cases like this, you’re likely to get more accurate by categorising spend based on the type of product or service you purchased, rather than using company-specific data.
To go back to the Amazon example, it’s better to categorise your £10 as “electrical items – IT” and apply the relevant emissions factor – rather than trying to apportion a slice of Amazon’s global footprint.
The question to ask yourself is: is what I buy from my supplier (the product or service mix) representative of their business as a whole. This is less likely to be the case if the supplier is large and offers a broad range of products and services.
Step 2: Identify Your Top 10–20 Suppliers
You should now have transformed your spend data into a table of emissions figures. This is a quick way to build a comprehensive picture of Scope 3 Emission Category 1 - Purchased Goods and Services. Now, we can use it as a basis to figure out where to dig deeper, something called hotspot analysis.
Sort your supplier list by CO₂e and identify your top 20 suppliers by emissions contribution. By doing this, we can focus our efforts to get more accurate on the highest impact areas.
Step 3: Shift to Activity-Based Metrics Where Possible
Next, try to incorporate activity-based rather than spend-based data. This is where we shift from relying on £s as our metric that underpins our carbon calculations to a more specific business metric. Here are 2 practical examples of shifting from spend to activity metrics:

You’ll noticed 2 things:
- Activity-based metrics ignore fluctuations in the price of goods and service, using unit weight or volume instead
- Activity-based conversion factors are typically more detailed than their spend-based counterparts (e.g. ‘metal’ vs ‘recycled aluminium’)
For UK-based business, the conversion factors dataset published by DEFRA is your go-to source of activity based emissions factors.
Let’s explain what shifting from spend- to activity-based data means – and why it matters – using a case study.
Case Study: Seedling x Zero
Seedling teamed up with sustainable banking app Zero to estimate their carbon footprint. When it came to capturing the carbon footprint of their debit cards, rather than relying on spend with their debit card supplier, and multiplying it by a spend-based factor for “plastic goods,” we:
- Measured the weight of recycled plastic per card, and scaled it up to total purchase volume
- Multiplied this weight by a material-specific emissions factor: kg CO₂e per gram of recycled PVC
To understand why this matters, consider what would happen to Zero’s carbon footprint if they paid extra to switch from using virgin plastic to recycled plastic, tracking emissions based on spend versus the activity based method above.
Furthermore, imagine Zero paid a 20% premium for switching to recycled plastic – it’s common for products marketed as more ‘sustainable’ to be more expensive.
Under the spend-based method, that 20% increase in £s spent would correspond to a 20% increase in emissions. Under the activity-based method, instead we switch from a virgin plastic (PVC) conversion factor to a recycled PVC emissions factor. This meant that Zero’s footprint decreased by 30-40% reflecting their use of ‘better’ materials, and crucially the price premium did not have an impact – much more accurate!
To top it all off, activity-based conversion factors are often much more specific and granular than their spend-based counterparts (‘recycled PVC’ versus ‘plastics’ as an example), helping you get even more accurate.
Using activity data in place of spend means that the steps your business takes to decarbonise are actually reflected in your carbon footprint data, helping you to reduce emissions over time and make progress toward your Net Zero target.
Activity-based assessments work particularly well for product-based businesses or manufacturers that purchase raw materials, like metals, plastics, paper and cardboard, other construction materials, food, chemicals, and fuel. What’s key is to build systems – such as within your ERP or PLM – that enable your business to track the weight and type of material produced.
Step 4: Project-or-product-specific emissions – the holy grail
Requesting emissions data from your suppliers can be done ad hoc to start with, but we recommend making it a standard part of procurement and onboarding – something all suppliers are asked for over time. It makes sense to focus on the top 20 highest-impact suppliers you’ve already identified.
There are two main types of data you may be able to get your hands on:
- Company-level emissions, which can be apportioned by spend as discussed above. Remember, this method if often less accurate than the activity-based method, so tread carefully
- Product or project-specific emissions data – AKA the holy grail.
It may be the case that your supply has conducted a focused emissions measurement exercise for the specific project or product that you purchase. If this is the case, it’s as simple as tracking the number of product/project ‘units’ purchased by your business, and multiplying that number by the emissions output.
Laptops are a broadly applicable example here. Manufacturers (like Dell, HP, and others) measure and publish the carbon footprint of the products they manufacture. All you need to do is research the Product Carbon Footprint (PCF) of the make and model purchased, and scale this up based on your order volume.
And that’s it – simple and accurate. At Seedling, we do this for you, utilising manufacturer datasets to reflect the product-specific emissions of what you buy – check out Systemagic’s case study as an example.
By incorporating product-specific data, your emissions will decrease when you choose lower impact (and often more expensive) products, rather than emissions simply tracking spend.
Business Travel
Business travel emissions vary widely. For some teams, they’re a small slice of your footprint. For others – especially in consulting, sales, or creative industries – they can be a major driver. Here’s how to approach measuring business travel emissions:
Step 1: Use a Spend-Based Assessment
Start with your expenses system. Export all travel-related spend (flights, trains, taxis, hotels). Then match each type of travel to a spend-based emissions factor – again available for free in the Small World Consulting spend-based factors dataset.
Here’s an example:

This is a fast, straightforward way to estimate emissions – especially helpful if you’re just getting started or need a quick overview.
Step 2: Use Activity-Based Data Where Possible
To measure emissions more accurately, you’ll want to shift from spend to activity-based measurement, just as we discussed for Purchased Goods and Services. For travel data, this means tracking transport mode and distance travelled, not just how much was spent.
As a result, systems are key to measuring business travel emissions accurately. Key sources of business travel data can include:
- Mileage claims (for personal or company vehicles)
- Travel portals (e.g. Trainline for Business, TravelPerk)
- Flight routes and classes from booking date
- If travel is infrequent, surveying employees might be just the trick
Here’s an example of using activity-based data to capture the emissions impact of a return train trip from London to Manchester (525 km total).

When it comes to business travel, activity-based data is especially valuable for comparing the carbon impact of transport modes (e.g. flight vs train), and reflecting the impact of changes you make.
Variability in travel prices means relying on spend-based measurement just won’t cut it if you want to track the impact of a sustainable travel policy. We recommend implementing a travel policy using the Sustainable Travel Hierarchy as a guide.
Employee Commuting & Working from Home
This category captures emissions from how your employees gets to work, and the energy they use if they’re working from home.
A lot of teams we chat to assume that home-working doesn’t contribute to business emissions, when it’s actually a key component of Scope 3 Emissions under a GHG Protocol–compliant footprint.
The challenge here is to understand your team’s working habits, and the best way to achieve this is with an employee survey.
Step 1: Start with an Employee Survey
Your survey will need to ask:
- How many days per week does each of your team commute to work
- What is their main mode of transport
- Roughly how far is their journey
- When not in the office, how often are they working-from-home versus elsewhere?
Remember, we’re looking to reflect average behaviours here. You’ll need to strike a balance between detail and creating a survey that your team can and will respond to, without taking up a load of their time.
For an example, check out Seedling’s ready-made employee survey. You’ll spot that we go the extra mile in addition to the questions above by asking questions about your team’s energy consumption habits – things like whether they have a green tariff or renewable energy generation at home.
This is a great way to get more accurate, but beyond the scope of this guide as it relies on more complex calculations. Chat to us if you’d like to learn more.
Step 2: Apply emissions factors
Once you’ve got the data, you’ll need to apply mode-specific emissions factors from the DEFRA conversion factors dataset. With Seedling’s employee survey, you skip this part. Employee responses upload automatically to the Seedling platform, and emissions are calculated for you. No Excel-analysis in sight.
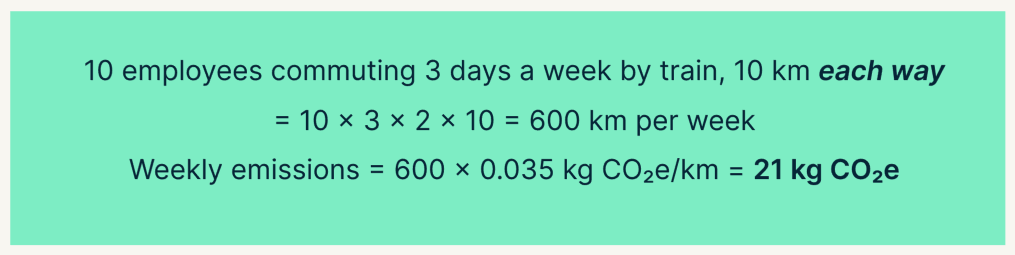
If you’re doing the analysis yourself, here’s an example of what your commuting methodology might look like. Remember, you’ll need to do this for each transport mode:
When it comes to home-working, you can use a top-down estimate using DEFRA’s WFH factors. Here’s an example:
.png)
The challenge here is that changes your employees make – such as better energy efficiency or adoption of renewables at home, won’t be reflected in your Scope 3 Emission footprint. To capture this, you’ll need to survey employees on their home-working habits. To see an example, check out Seedling’s employee survey.
Waste Generated in Operations
This category covers emissions from how your organisation disposes of its waste. As a general rule, the more you can split waste by type and disposal route, the more accurate (and actionable) your emissions estimate becomes.
Step 1: Understand your waste data
You’ll first need to build a picture of how much waste your business generates (weight in kgs), type (i.e. cardboard, food), and disposal method. There are a couple of ways to do this:
- Commercial waste contractor – you might be provided data by the company that manages your commercial waste. This could take the form of an information dashboard, or a breakdown that comes with your invoice. Data like this is fantastic in helping you to accurately measure emissions, and track the impact of any changes you make to reduce them
- Estimate waste yourself – without data from a third-party, you’ll need to monitor the waste your business produces over a typical week and then extrapolate that to the reporting period. You’re looking to understand typical bin weight, frequency of disposal, waste type and disposal route.
A third, more simple option is to use average waste per employee data based on the industry in which your business operates, and your recycling policy. This avoids having to collect waste data yourself, or through a third party.
However, the calculations here are a little tricky for the scope of this guide. If you’d like to learn more, you can chat to the Seedling team, or check out our free software carbon accounting software – Seedling starter – to see this time-saving approach in action.
Step 2: Apply emissions factors
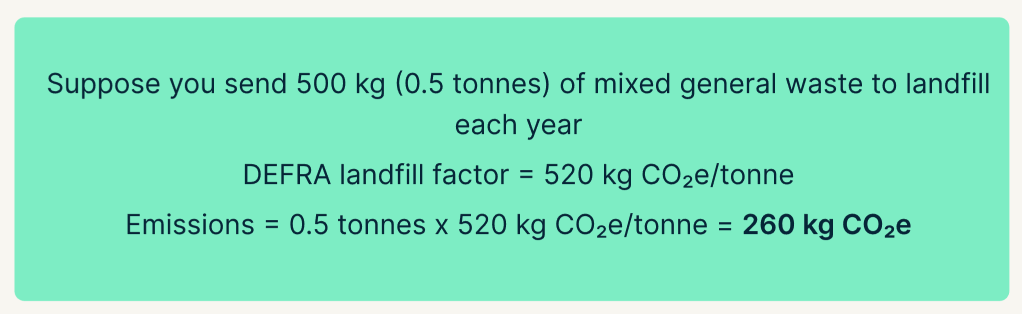
Head to DEFRA’s ‘waste disposal’ tab and apply emissions factors to the waste you produce based on type, weight, and disposal route. You’ll notice different waste streams have different emissions factors:
- Landfill (highest emission route across all categories
- Recycling (closed or open loop)
- Composting (food and paper-based waste)
- Incineration (converting waste into energy)
Here’s an example:
Step 3: Improve Data Over Time
To improve accuracy:
- Ask your waste contractor for annual weight data, or switch provide
- Review office behaviour (e.g. bin labelling, recycling uptake)
Final note: Remember to also factor in any one-off disposals, for instance when refreshing IT kit or during an office move.
Wrapping up
Top tips for getting more accurate with Scope 3 Emissions
Here’s a quick-fire recap of how to build a more accurate picture of Scope 3 / supply chain emissions:
- Ask your suppliers for emissions data. This can be a standard part of your procurement process. It will encourage your suppliers to implement their own emissions reduction strategy
- Switch to activity-based emissions measurement where possible. Otherwise, it’s likely your footprint will track spend, rather than the changes you make
- Check for publicly available Product Carbon Footprints (PCFs). As well as helping you to get more accurate, PCFs are a useful way to compare the impact of products and choose those which are lower impact, reducing your footprint.
And that’s a wrap! For more handy content, head to seedling.earth/insights For advice or support, chat to the Seedling team .
Start Managing
Your Carbon Footprint
Today
Benchmark your business’s climate action for free


Ready to get started?

Book a demo with one of our experts today, or get started right away for free.
.svg)