

If you design, make, or sell products, you’re increasingly likely to be asked: what are the emissions associated with your products? Your B2B clients (especially large buyers) are keen for accurate data they can rely on for their carbon reporting. Consumers are keen to understand the carbon impact of the products they’re buying and make better choices.
The practical way to respond is a Product Carbon Footprint: a quantified view of the greenhouse gases linked to one product across its life cycle, built on recognised standards and a clear method. Done well, a PCF helps you make targeted changes that cut emissions and costs, answer client questionnaires without the scramble, and tell a credible story about improvement.
This guide explains what a PCF is, why it pays to do one, which standards matter, and a proven process you can follow.
What is a Product Carbon Footprint (PCF)?
A Product Carbon Footprint is the total greenhouse gas emissions associated with a single product - which differs from an organisational or corporate carbon footprint (looking at emissions across your entire business).
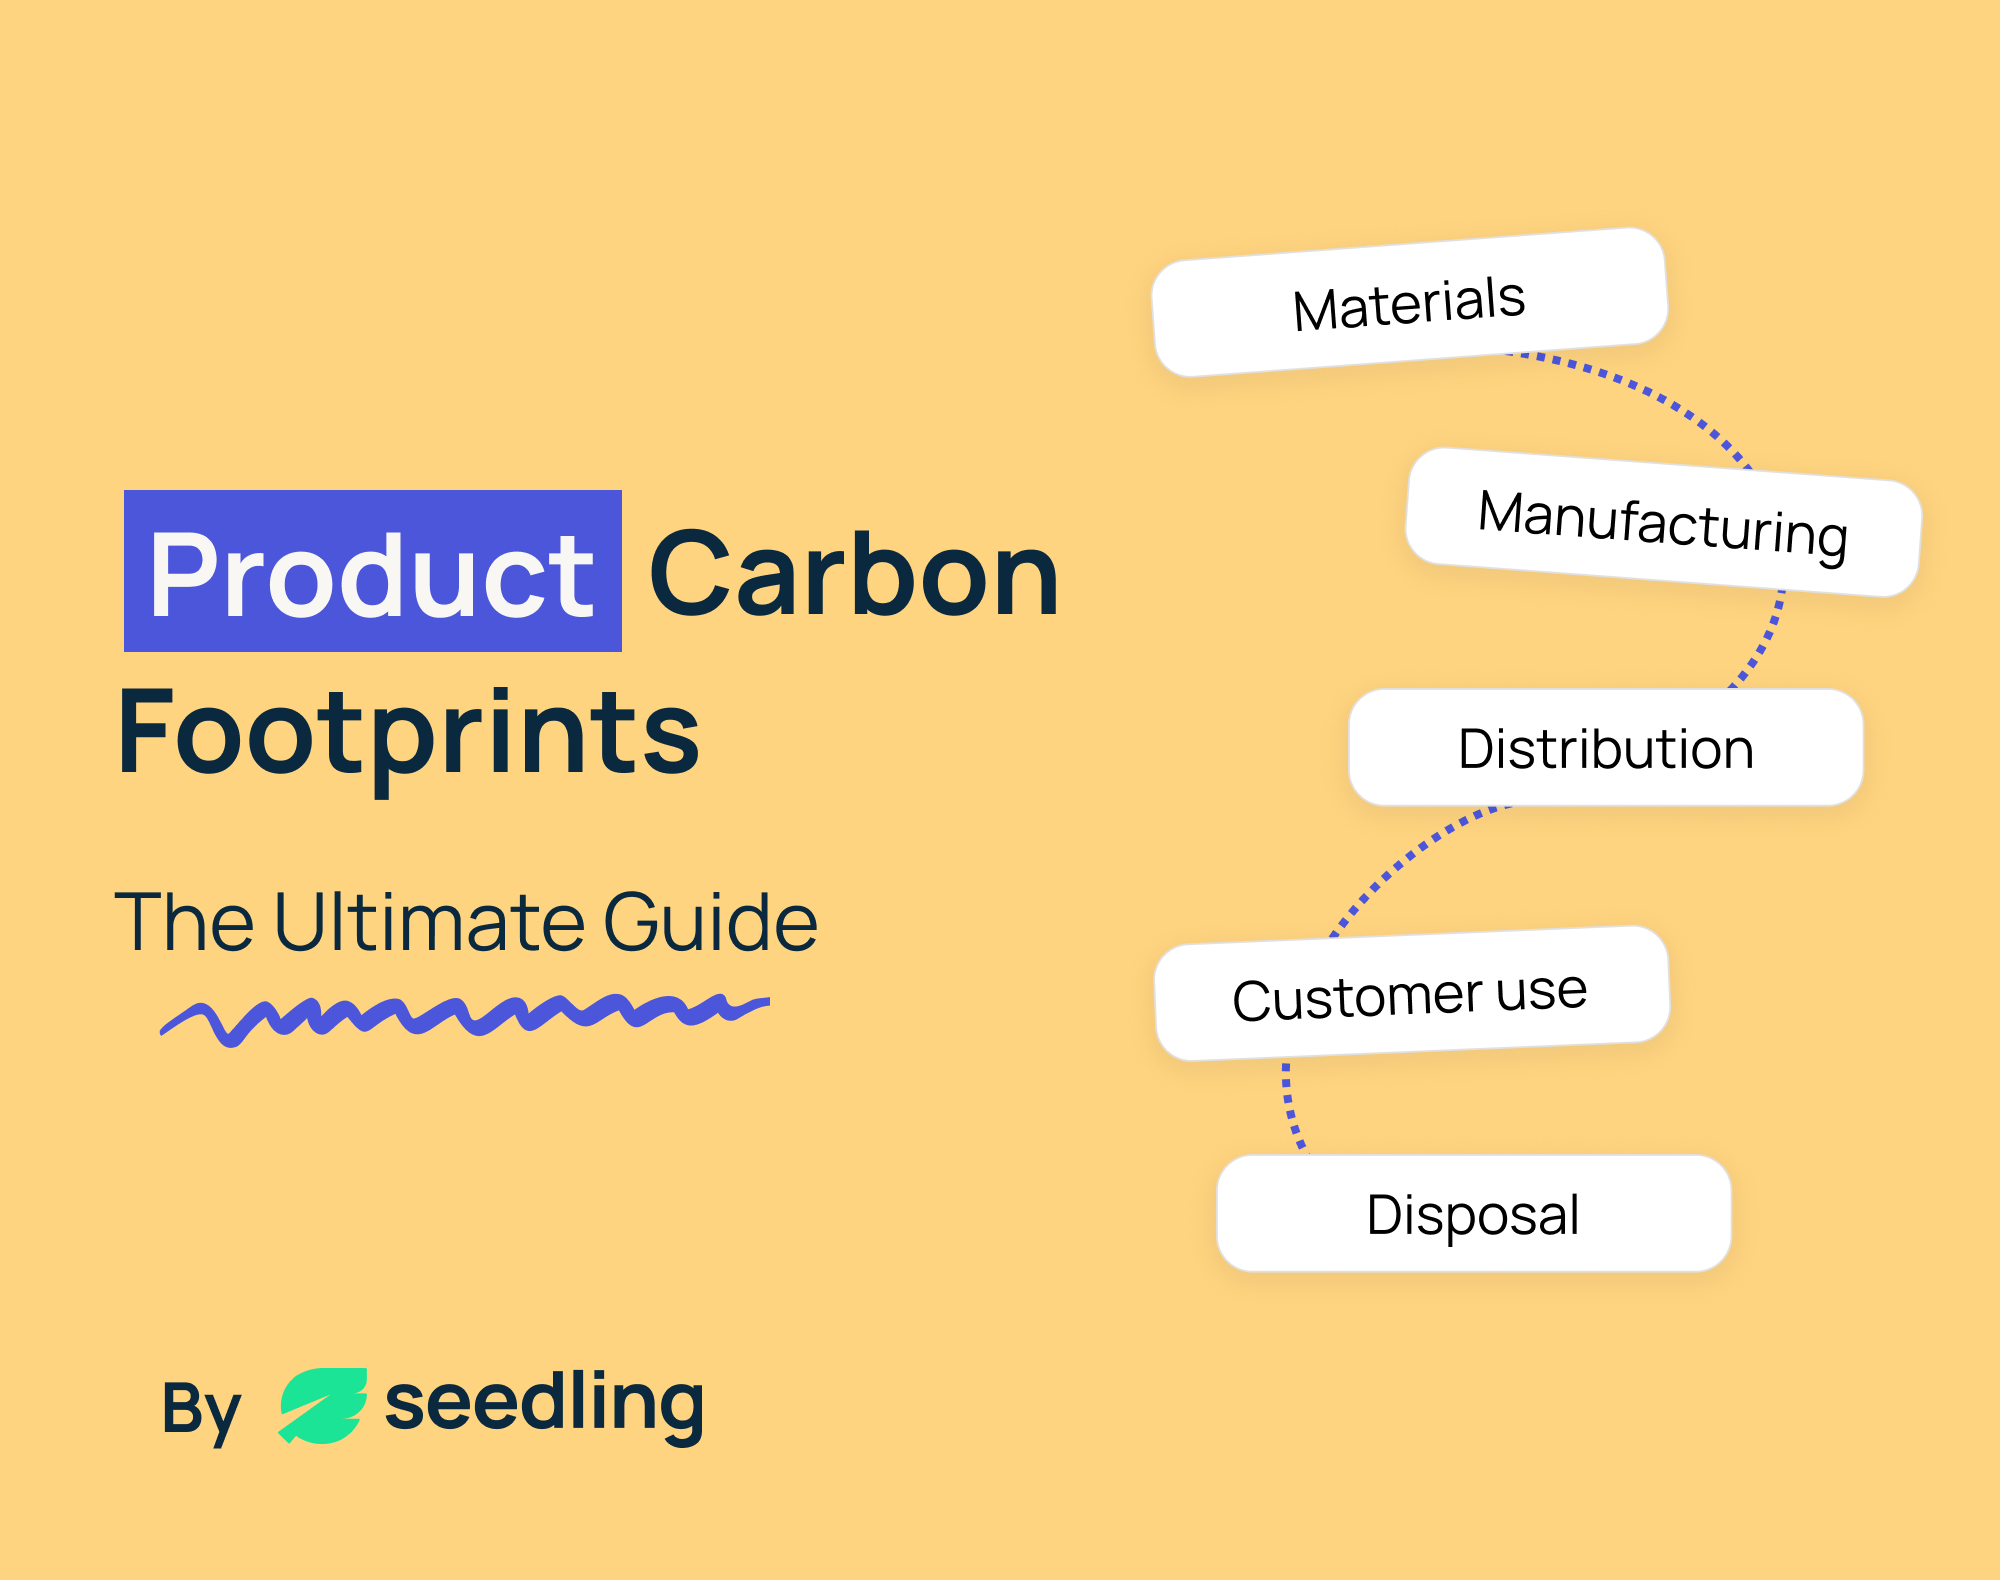
Emissions are measured over a defined life cycle. Many teams start with a cradle-to-gate assessment: raw materials, through manufacturing, up to the factory gate. Others need cradle-to-grave: add distribution to the customer, energy usage, and end-of-life disposal.
The result is expressed per functional unit, which is a precise description of what is delivered, for whom, and for how long. For example: “1 kilogram of roasted coffee beans delivered to retail,” or “one office chair used for eight years.” This framing matters. It makes your result comparable and useful for decisions.
PCFs focus on one impact: climate change. That makes them faster to deliver than a full Life Cycle Assessment, while still giving you enough resolution to redesign materials, packaging, energy use, and logistics with confidence. Many organisations use PCFs to prioritise reduction work now, then expand to a fuller LCA later as capability grows.
Why do a PCF?
As a product business, there are a few key reasons why you might want to consider conductign product carbon footprints:
- You find and fix the real hotspots. Most product emissions concentrate in a handful of stages or inputs. A PCF reveals those hotspots with data you can act on. You can test material swaps, set recycled-content targets, tune energy consumption on a critical process, re-think packaging formats, or change shipment modes. Decisions stop being generic and start being surgical.
- You can report with credibility. Buyers increasingly ask suppliers for product-level numbers, often aligned to specific standards. The GHG Protocol Product Life Cycle Standard and ISO 14067 give you a recognised way to calculate and disclose. That helps you pass due diligence, support eco-design claims, and contribute accurate data into customer Scope 3 baselines.
- You build trust with customers. Clear, standard-aligned product claims reduce greenwash risk and help people choose lower-impact options. If you share a breakdown by life-cycle stage and explain assumptions in plain language, you’ll stand out for transparency.
The standards that govern PCFs
There are three names you’ll hear often when it comes to standards that govern product carbon footprinting. Here is what each one does and how they differ.
- ISO 14067:2018. This is the international standard for quantifying and reporting the carbon footprint of products. It sits on the foundations of ISO 14040 and 14044 for life cycle assessment and sets principles, requirements, and guidance for both full and partial product footprints. It also describes how to report results, including functional unit, boundaries, allocation, and data quality. Many third-party verifications use ISO 14067 as the bar.
- GHG Protocol Product Life Cycle Accounting and Reporting Standard. Developed by WRI and WBCSD, this standard provides detailed requirements and guidance to quantify and publicly report product GHG emissions and removals across the life cycle. It is widely used by companies and programs because it connects cleanly to the corporate GHG Protocol and Scope 3 accounting.
- PAS 2050. BSI’s specification from 2008, updated in 2011, was the first consensus standard that many sectors used to kick-start product carbon footprinting. Its methods influenced both ISO 14067 and the GHG Protocol Product Standard and it still appears in some customer requirements.
How do they compare in practice? ISO 14067 is a formal ISO standard with tight rules on quantification and reporting. The GHG Protocol Product Standard is a requirements-plus-guidance manual that many procurement teams recognise and that aligns with corporate accounting. Many organisations simply align with both so they have methodological rigour and stakeholder familiarity. There is also a live effort to harmonise terminology and rules across ISO and the GHG Protocol, which should make life easier for teams juggling multiple frameworks.
Completing a Product Carbon Footprint: Step-by-Step
A strong PCF reads like a good research paper: a clear question, a defined scope, transparent data, reproducible calculations, and a fair discussion of limitations. Here is a process you can run with a small cross-functional team.
1) Define the goal, scope, and boundary
Start with why you are doing this and who will use the result. Decide the functional unit. Choose your life-cycle boundary: cradle-to-gate or cradle-to-grave. Set the temporal and geographic scope, the product variants in scope, and any exclusions.
2) Map the product system
Draw the process flow from raw materials to end-of-life. For each unit process, list inputs and outputs: material quantities, energy carriers, transport legs, pack formats, yields and scrap, and any notable emissions or by-products. Note data ownership across your supply chain and what you expect to get as primary data versus what you will source from background databases. The map helps avoid blind spots and makes supplier requests specific.
3) Collect data with a “primary where it matters” rule
Use primary data for processes you control and for high-impact suppliers where feasible. Examples include material specifications and weights, machine-level energy use, yield losses, and actual shipment distances and modes. Use high-quality secondary data for background processes and far-upstream tiers. Record sources, representativeness, age, and uncertainty. This audit trail is essential for defensible results and for re-runs when you change a component.
4) Apply emission factors and calculate
Multiply your activity data by the right emission factors. Keep consistency between data and factors on geography, time, and technology. Document allocation methods for multi-output processes and any system expansion you use for recycled content or end-of-life credits. Then roll results up to the functional unit and to life-cycle stages so you can see the pattern. Cross-check totals and reasonableness against comparable products where public data exists.
5) Analyse hotspots and design reduction measures
Rank emission contributors by process and life-cycle stage. The top few items are your main levers.
Typical actions include switching to lower-carbon or recycled materials, redesigning a part for lower mass or longer life, reducing scrap, electrifying or optimising thermal processes, switching to low-carbon energy, changing packaging formats and recycled content, and moving from air to sea where lead times allow.
Model realistic scenarios before you commit, then build a roadmap that sequences quick wins and bigger design changes.
6) Report and communicate responsibly
Summarise the method, boundary, functional unit, data sources, totals in kg or tonne of CO₂e per functional unit, and a breakdown by life-cycle stage. Explain assumptions and uncertainties. Consider third-party verification if your market expects it.
Good practice that separates credible from questionable
Keep the same functional unit in any comparison. Be clear about what is in and out of scope. Prefer activity data to spend where possible, because spend often tracks price movements rather than physical change. Keep versioned methods so you can re-issue results when you improve data quality or update a component. Where buyers require it, secure verification against ISO 14067 and make the statement available alongside your PCF.
Common pitfalls to avoid
- Undefined or shifting boundaries. If you move from cradle-to-gate to cradle-to-grave midway, you will distort trends. Lock the boundary and document it.
- Comparing unlike with unlike. Two beverages in different pack sizes are not directly comparable without a shared functional unit. Reset the unit or avoid making any comparison claims.
- Using generic factors for critical processes. If your hotspot is resin production or heat-intensive forming, invest in better data. A default factor could be off by a wide margin, which flips your priority list.
- Treating end-of-life benefits as guaranteed. If you claim credits for recycling, base them on plausible collection and sorting rates for your markets, not ideal-world assumptions.
- Publishing a number without a plan. The value of a PCF is the action it unlocks. Buyers and consumers expect to see the reduction roadmap next to the number.
A note on standards alignment and what’s coming
If your customers operate across regions or you supply multiple sectors, you may be juggling overlapping rules. The good news: ISO and the GHG Protocol have announced plans to align carbon accounting frameworks to improve consistency across measurement and reporting. Watch this space for updates if you currently manage to both ISO 14067 and the GHG Protocol Product Standard in parallel. Alignment should reduce duplication and confusion.
How Seedling helps you deliver PCFs that move the needle
For many SMEs, the blocker is not intent. It’s time, data, and method. Seedling solves that with a product-level workflow that fits how teams actually work and sell:
- Measure with accuracy, not rough spend proxies. Inside Seedling, you gather the activity data that drives product emissions: material weights and specifications, pack formats, energy use by process, shipment legs and modes. Our calculation engine applies recognised methods so your results align with the GHG Protocol. If there are gaps, your Seedling adviser suggests the most accurate approach and helps you improve year on year.
- See hotspots instantly and plan reductions. Your dashboard segments results by life-cycle stage and category, ready for hotspot analysis and design trade-offs. You can understand the likely impact from material swaps, energy changes, or logistics tweaks, and translate that into a practical decarbonisation plan you can own.
- Share a product impact page with buyers. Each product can have a clean, shareable impact page that shows the footprint per functional unit, a breakdown by stage, method notes, and your reduction roadmap. Link it in RFPs, line sheets, and packaging. Buyers see credible data. Your sales team gets a simple asset that saves back-and-forth.
- Expert guidance, on tap. You don’t need to hire an LCA specialist. Your Seedling account manager walks you through scoping, supplier requests, data quality checks, and claims language so you publish with confidence and avoid greenwash risk.
Product Footprinting FAQs we hear from product teams
Do we need cradle-to-grave?
If your buyers or ecolabels ask for it, yes. If you’re optimising manufacturing, cradle-to-gate might be a practical first step. Be explicit about the boundary in any claim.
Which standard should we cite?
If your market prefers ISO, cite ISO 14067 and follow its reporting guidance. If you need strong buyer recognition and a bridge to corporate accounting, cite the GHG Protocol Product Standard. Many teams reference both to cover method and communication expectations.
Can we compare to a competitor?
Comparison is high-risk unless the functional unit, boundary, and methods match. If you publish a comparison, disclose methods and ensure like-for-like. Better: show your own improvement over time on the same basis.
Where does PAS 2050 fit now?
Some buyers still request it, especially in legacy programs. Treat it as a useful reference and focus your core method on ISO 14067 or the GHG Protocol Product Standard.
Final word
Product Carbon Footprints are no longer a niche exercise. They are becoming the language of procurement, product design, and credible marketing. If you clarify your scope, map your system properly, favour primary data where it counts, and report transparently against recognised standards, you will get three wins: meaningful reductions, smoother sales cycles, and a brand that customers trust.
Seedling is built to help you do exactly that. Measure product-level emissions with accuracy, see the hotspots, publish a shareable impact page, and keep improving without drowning your team in spreadsheets. If you’d like to turn this guide into a working PCF playbook for your products, we can set that up and have your first impact pages ready to share with buyers.
Start Managing
Your Carbon Footprint
Today
Benchmark your business’s climate action for free


Ready to get started?

Book a demo with one of our experts today, or get started right away for free.
.svg)